Cristina Frizza
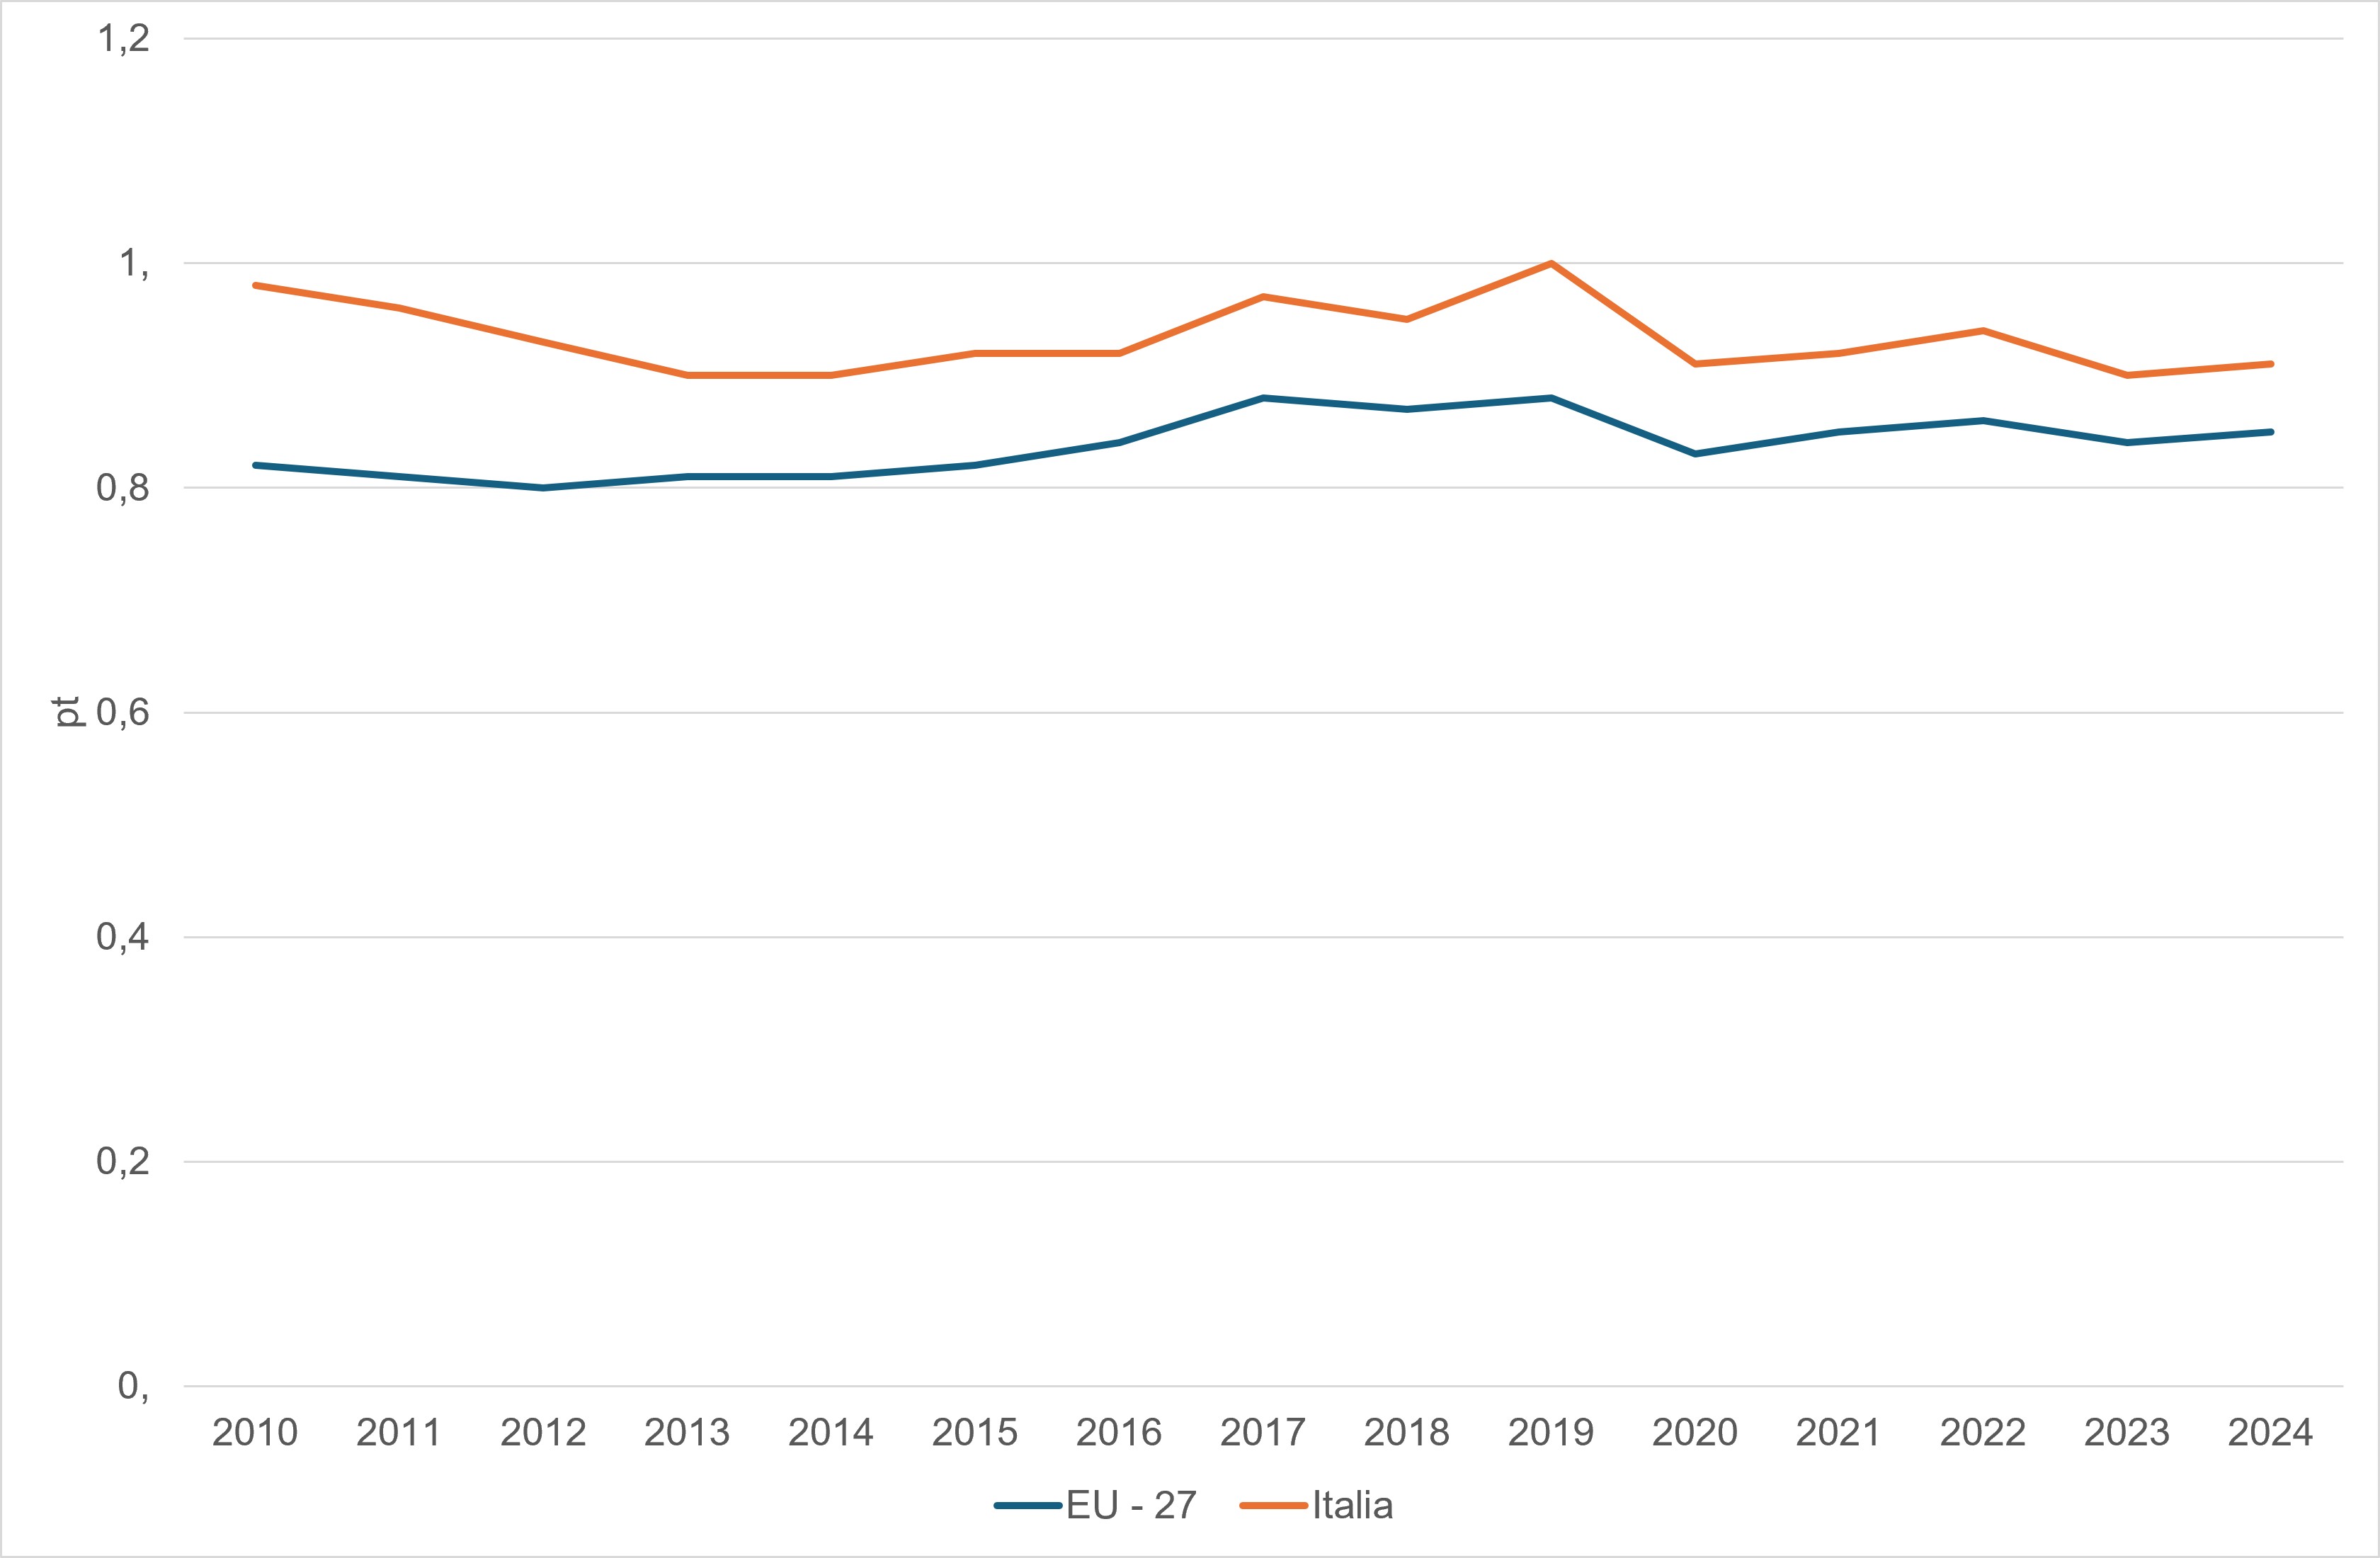
The indicator quantifies the environmental impact of Italian consumption through 16 indicators based on the life cycle (LCA). In the period 2010-2024, the national consumption footprint index recorded a reduction of 8% (dropping from 100 to 92), compared to a 6% increase in the EU-27 average. However, analyzing the trend per inhabitant, Italy's single score, despite having dropped from approximately 0.98 pt to 0.91 pt, remains constantly higher than the European average (which went from 0.82 pt to 0.85 pt), highlighting an environmental pressure per capita that is still high compared to the community context. The objective is to monitor the decoupling between consumption and impacts to fall within planetary limits.
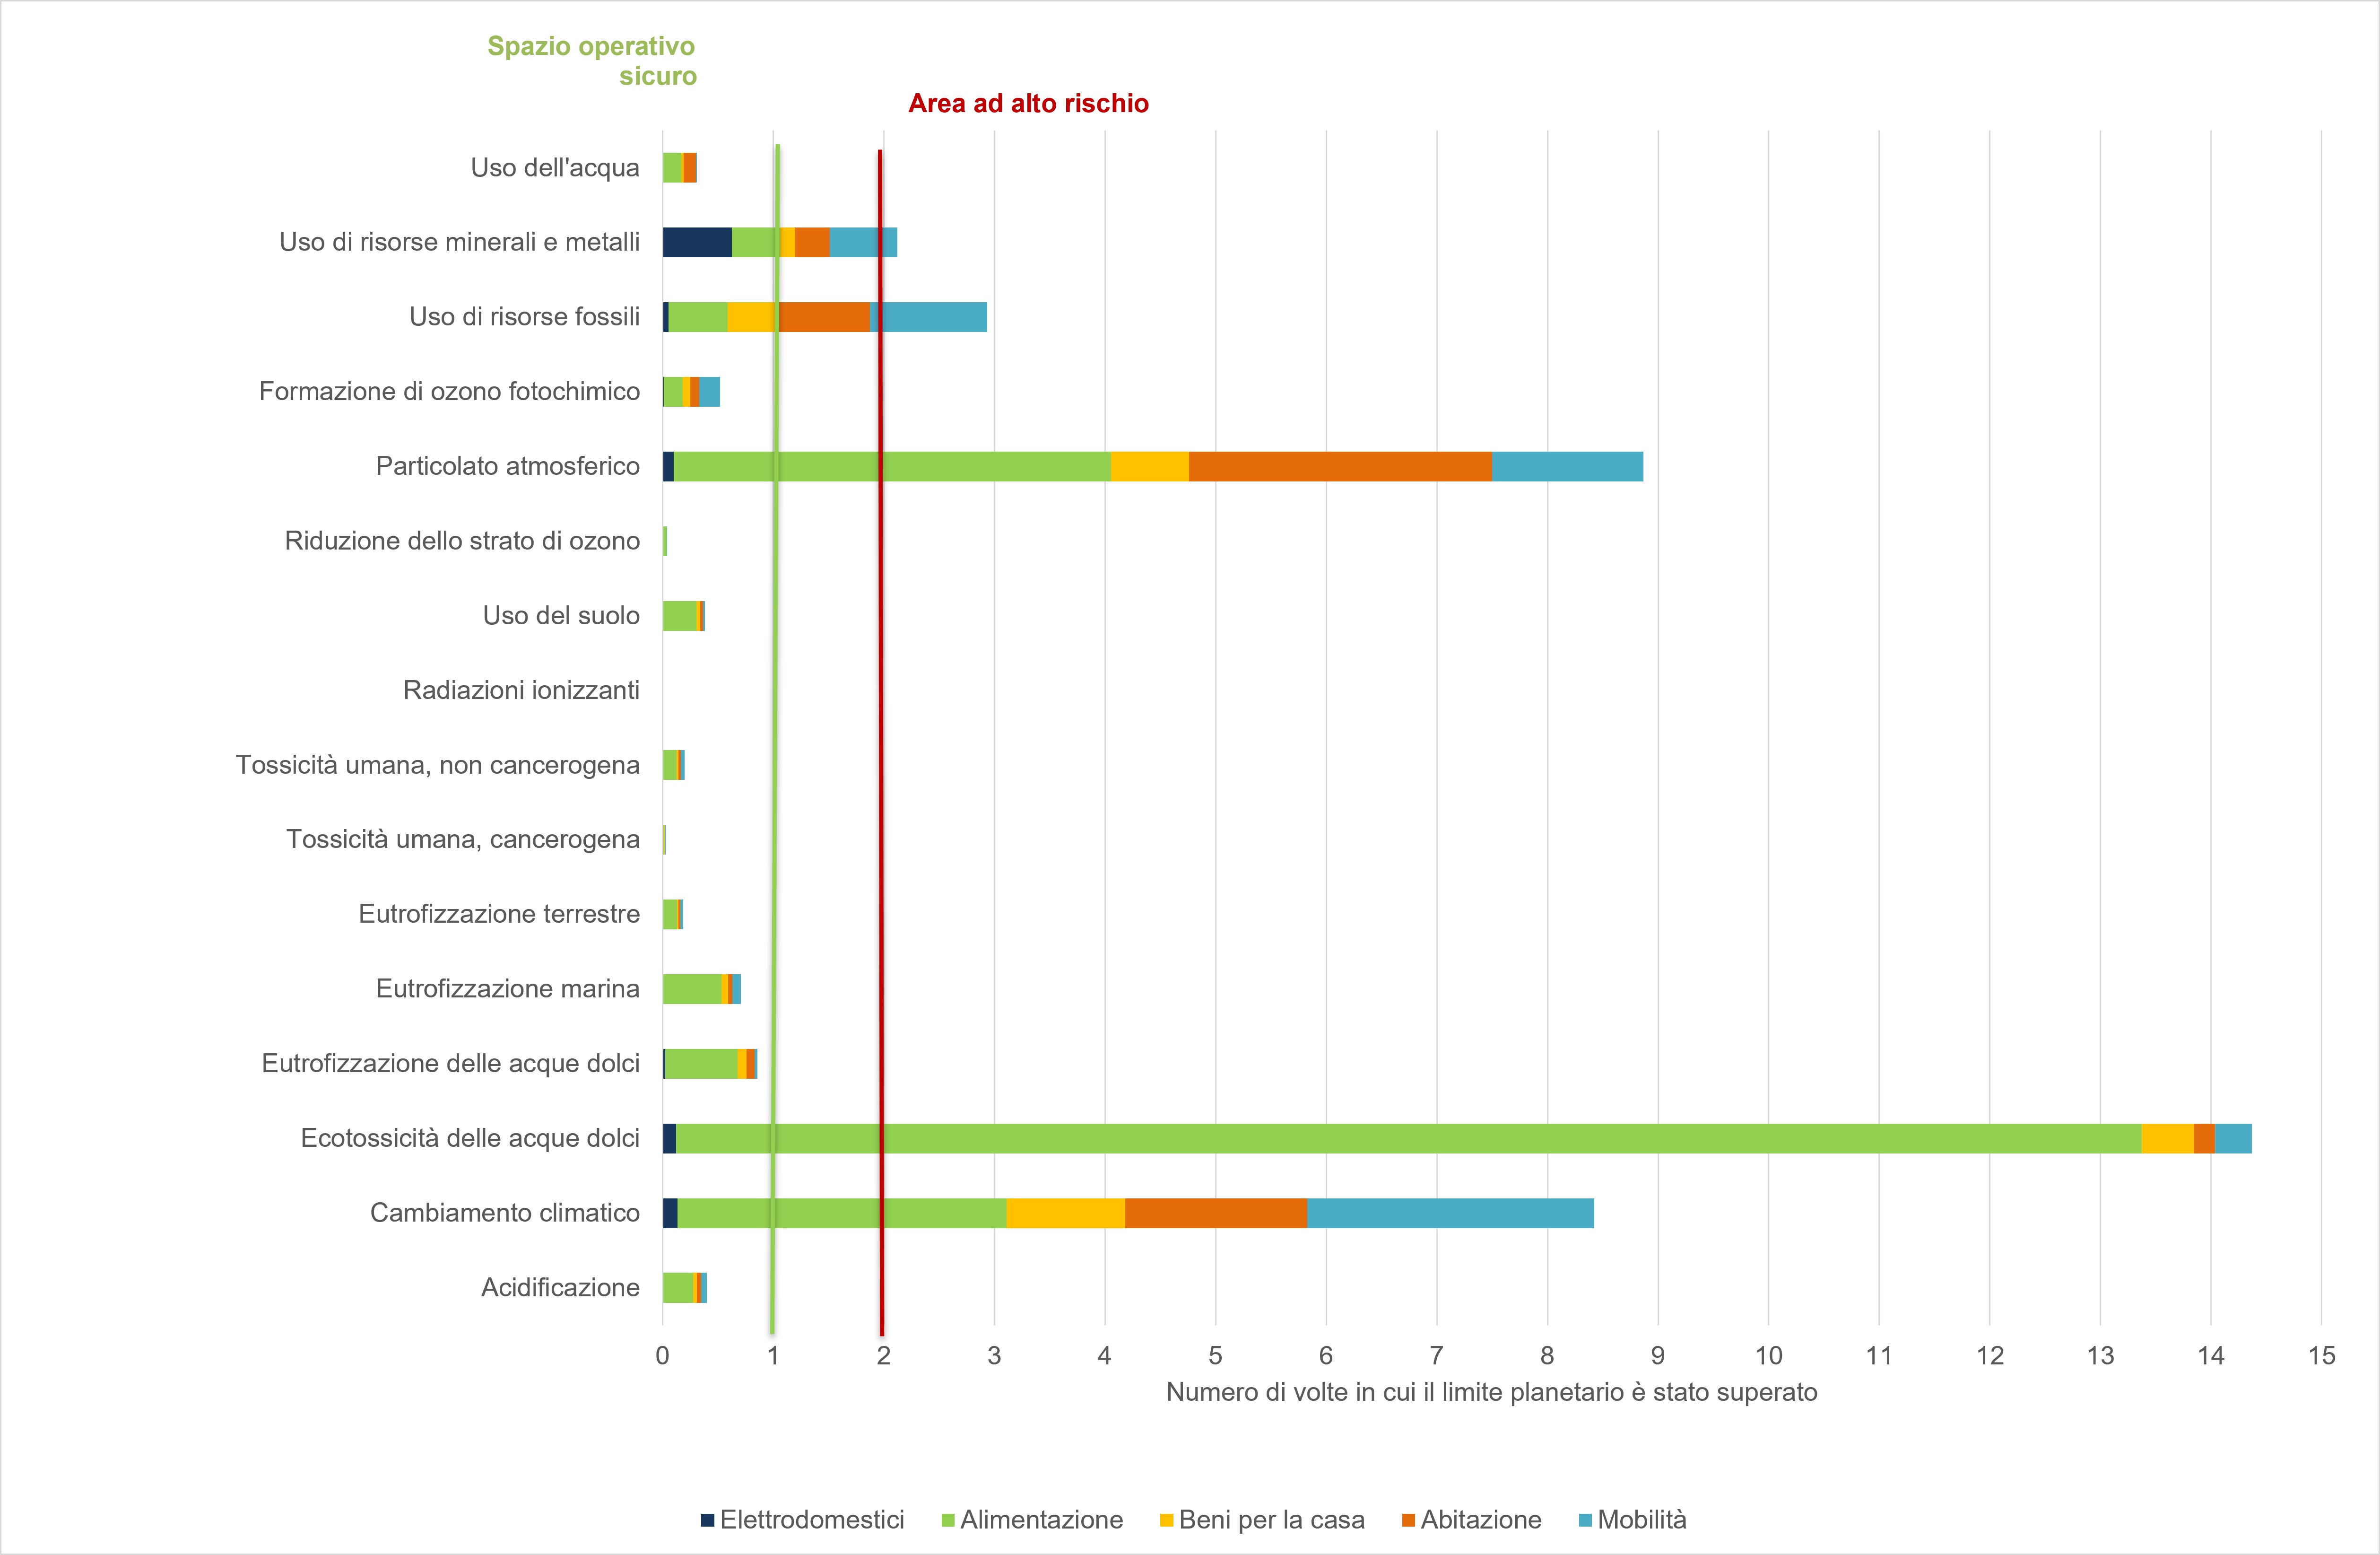
The indicator measures the environmental pressure associated with national final consumption throughout the entire life cycle of the goods and services consumed, including the impacts incorporated in imports and those generated abroad to satisfy domestic demand. The indicator covers five main areas of consumption: household appliances, food, household products, housing and transport. The results are expressed through an aggregate score that summarizes 16 environmental impact categories, including climate change, use of fossil resources, use of minerals and metals, use of water resources, land use, acidification, eutrophication and particulate emissions with effects on human health. The indicator also allows us to evaluate the sustainability of consumption models with respect to the Planetary Boundaries, i. e. The biophysical thresholds identified by the scientific community that define the safe operating space within which human activities can develop without compromising the stability, resilience and self-regulation capacity of the Earth system. The comparison with these thresholds allows us to verify whether the environmental pressures associated with consumption are compatible with long-term sustainability objectives. Yes without compromising the Earth system's ability to self-regulate.
Measure the environmental pressure associated with national consumption patterns, allowing you to: monitor the sustainability of consumption; evaluate the indirect impacts of imports; support circular economy strategies; integrate the environmental dimension into sustainable production and consumption policies.
Circular Economy Action Plan (COM/2020/98).
Farm to Fork Strategy.
EU Biodiversity Strategy 2030.
European Commission (2023), Monitoring framework for the circular economy; JRC, Consumption Footprint Platform
EC - Joint Research Center (JRC)
Eurostat
National
2010-2024
The Consumption Footprint developed by the European Commission - Joint Research Center (JRC) is a composite indicator based on Life Cycle Assessment (LCA) methodologies, aimed at estimating the environmental impacts associated with final consumption. The indicator considers the entire life cycle of goods and services consumed, including production, transport, use and end of life, regardless of where the impacts are generated. The model is built starting from approximately 160 representative products divided into five macro-consumption domains: food, mobility, housing, household goods and appliances. Consumption data derive mainly from Eurostat statistics and are combined with environmental databases and LCA coefficients. Impacts are calculated for several environmental categories, including climate change, resource use, acidification and eutrophication. Subsequently the categories are normalized and weighted according to the European Environmental Footprint methodology, obtaining a synthetic indicator expressed in "Points" (Pt). The Consumption Footprint therefore allows a "consumption-based" assessment of environmental pressures, also including the impacts incorporated into imports.
Further information on the methodology can be found in the document “Consumption Footprint: methodological overview – A life cycle assessment-based model to assess environmental impacts of consumption” available at the following link https://publications. jrc. ec. europa. eu/repository/handle/JRC132734
The assessment of the state cannot be defined as positive as Italy's consumption footprint determines an environmental pressure that exceeds planetary safety limits (3.42 planetary boundaries) (Table 2). In 2024, the Italian per capita impact is 0.91 points, a value higher than the European average (0.85). This excess with respect to the self-regulation capacity of ecosystems and with respect to the community context defines a critical environmental situation.
The trend is assessed as "positive" since the trend in national consumption goes in the desirable direction of a reduction in environmental pressures. Between 2010 and 2024, the Consumption Footprint index for Italy recorded a decrease of 8% (dropping from base 100 to 92). This result is particularly significant when compared with the average of the European Union, which in the same period of time saw its index rise to 106 (+6%) (Table 1).
| Allegati |
|---|
Headline
Table 1: Consumption footprint Index, 2010=100 Data source
Eurostat |
Headline
Table 2: Assessment against planetary boundaries by environmental impact category Data source
Eurostat |
Thumbnail
Headline
Figure 1: Consumption footprint trend Data source
ISPRA analysis based on European Commission (Joint Research Centre) data |
Thumbnail
Headline
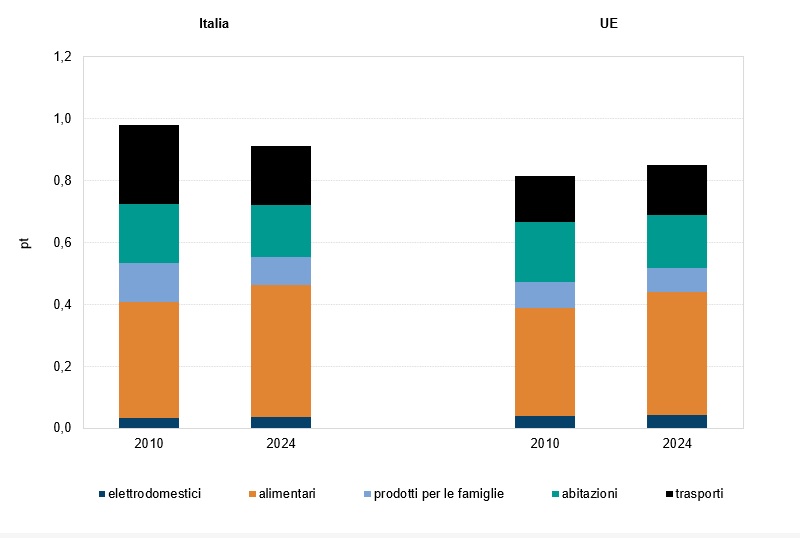
Figure 2: Contribution to the consumption footprint by product group. Years 2010 and 2024 (single weighted score – per capita impact) Data source
ISPRA analysis based on European Commission (Joint Research Centre) data |
Thumbnail
Headline
Figure 3: Assessment against planetary boundaries by category – Italy (2024) Data source
European Commission |
In the period 2010-2024, Italy's Consumption Footprint highlights a reduction in environmental pressures associated with final consumption above the European average. The national index (2010=100) stands at 92 in 2024, compared to a value of 106 for the EU-27, indicating a more marked decoupling between consumption and environmental pressures compared to the European context. Despite the favorable trend, the absolute level of the Italian per capita impact remains higher than the EU average (0.91 Pt versus 0.85 Pt in 2024), highlighting how the national consumption model continues to generate significant environmental pressures. The "nutrition" component represents the main contribution to the overall footprint, accounting for approximately 47% of the total, while significant reductions are observed in the impacts related to transport and housing (Figure 2). Furthermore, the overcoming of some planetary boundaries is noted, in particular for the ecotoxicity of fresh waters, climate change, particulate emissions and the use of fossil fuels, climate change, indicating that current consumption models are not yet fully compatible with long-term sustainability objectives (Figure 3, Table 2). The Consumption Footprint therefore constitutes a complementary indicator useful for supporting the monitoring of Goal 12 of the 2030 Agenda and the European Strategies for the circular economy.