Gabriella Aragona, Lucia Muto
The indicator measures the national average cost incurred by municipalities to provide the urban sanitation service, expressed per inhabitant and per kg of waste generated. In 2024, the average annual management cost was EUR 214.4 per inhabitant and 41.8 euro cents per kg of municipal waste generated.
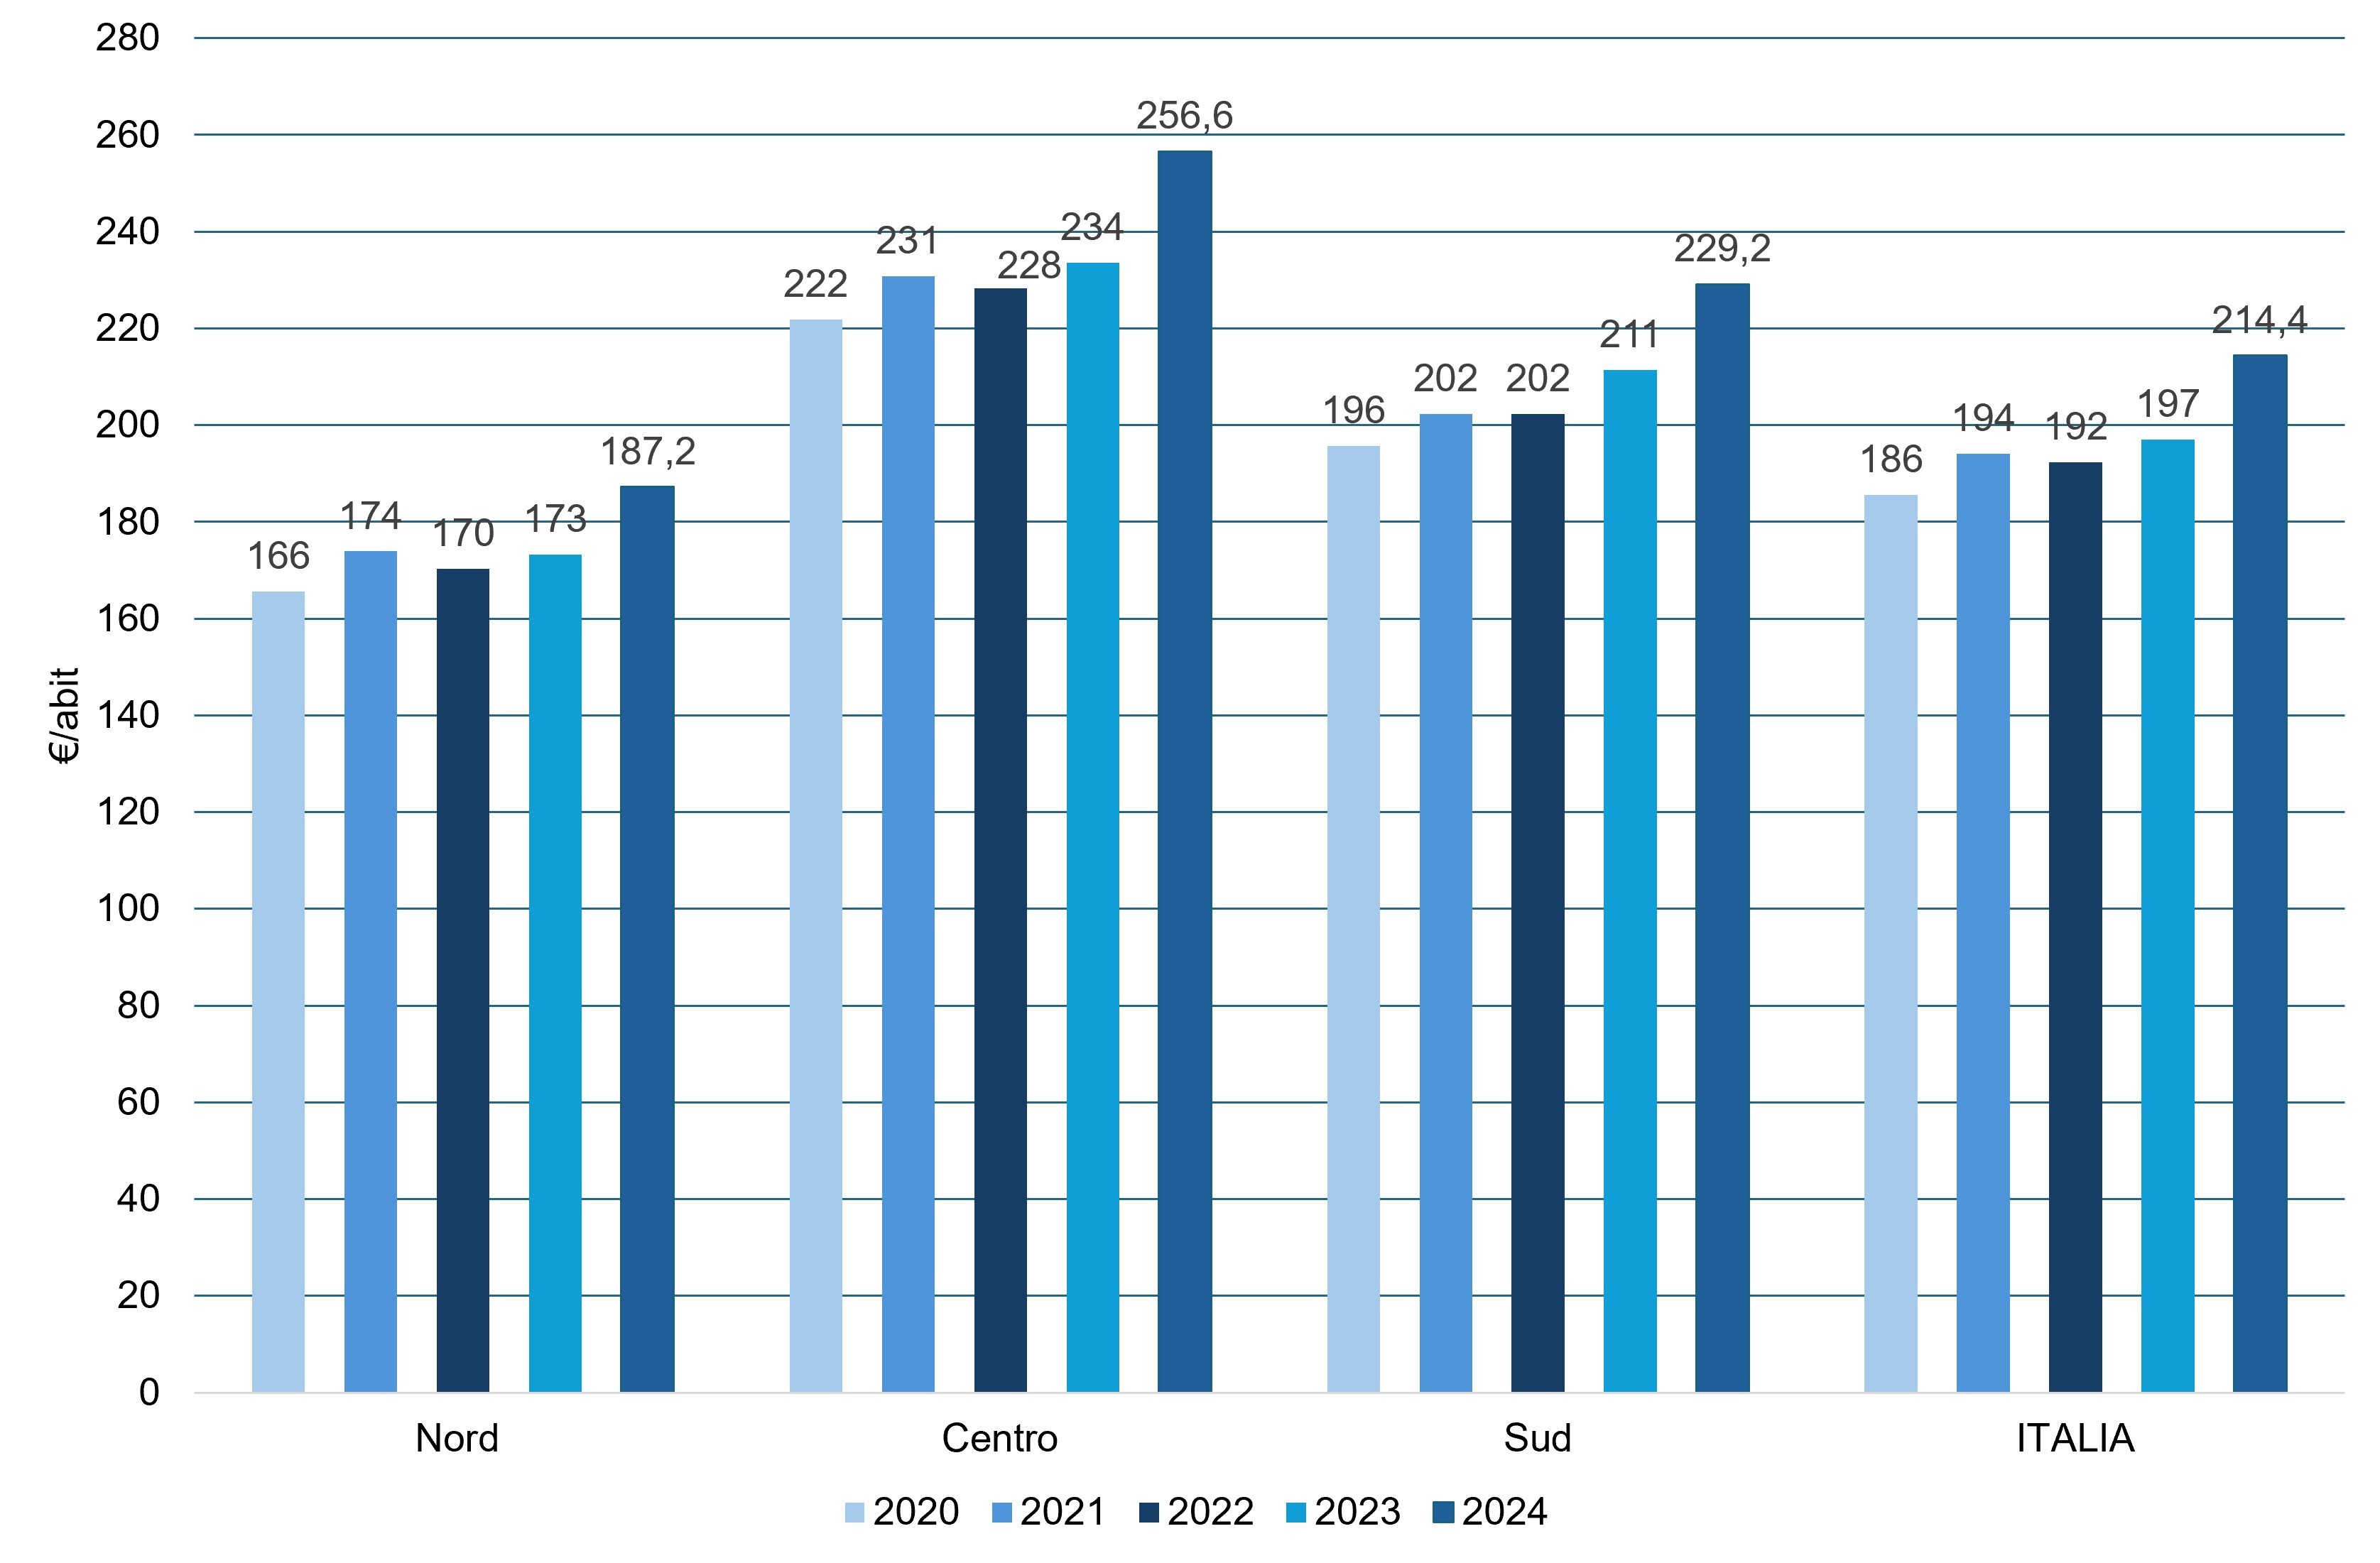
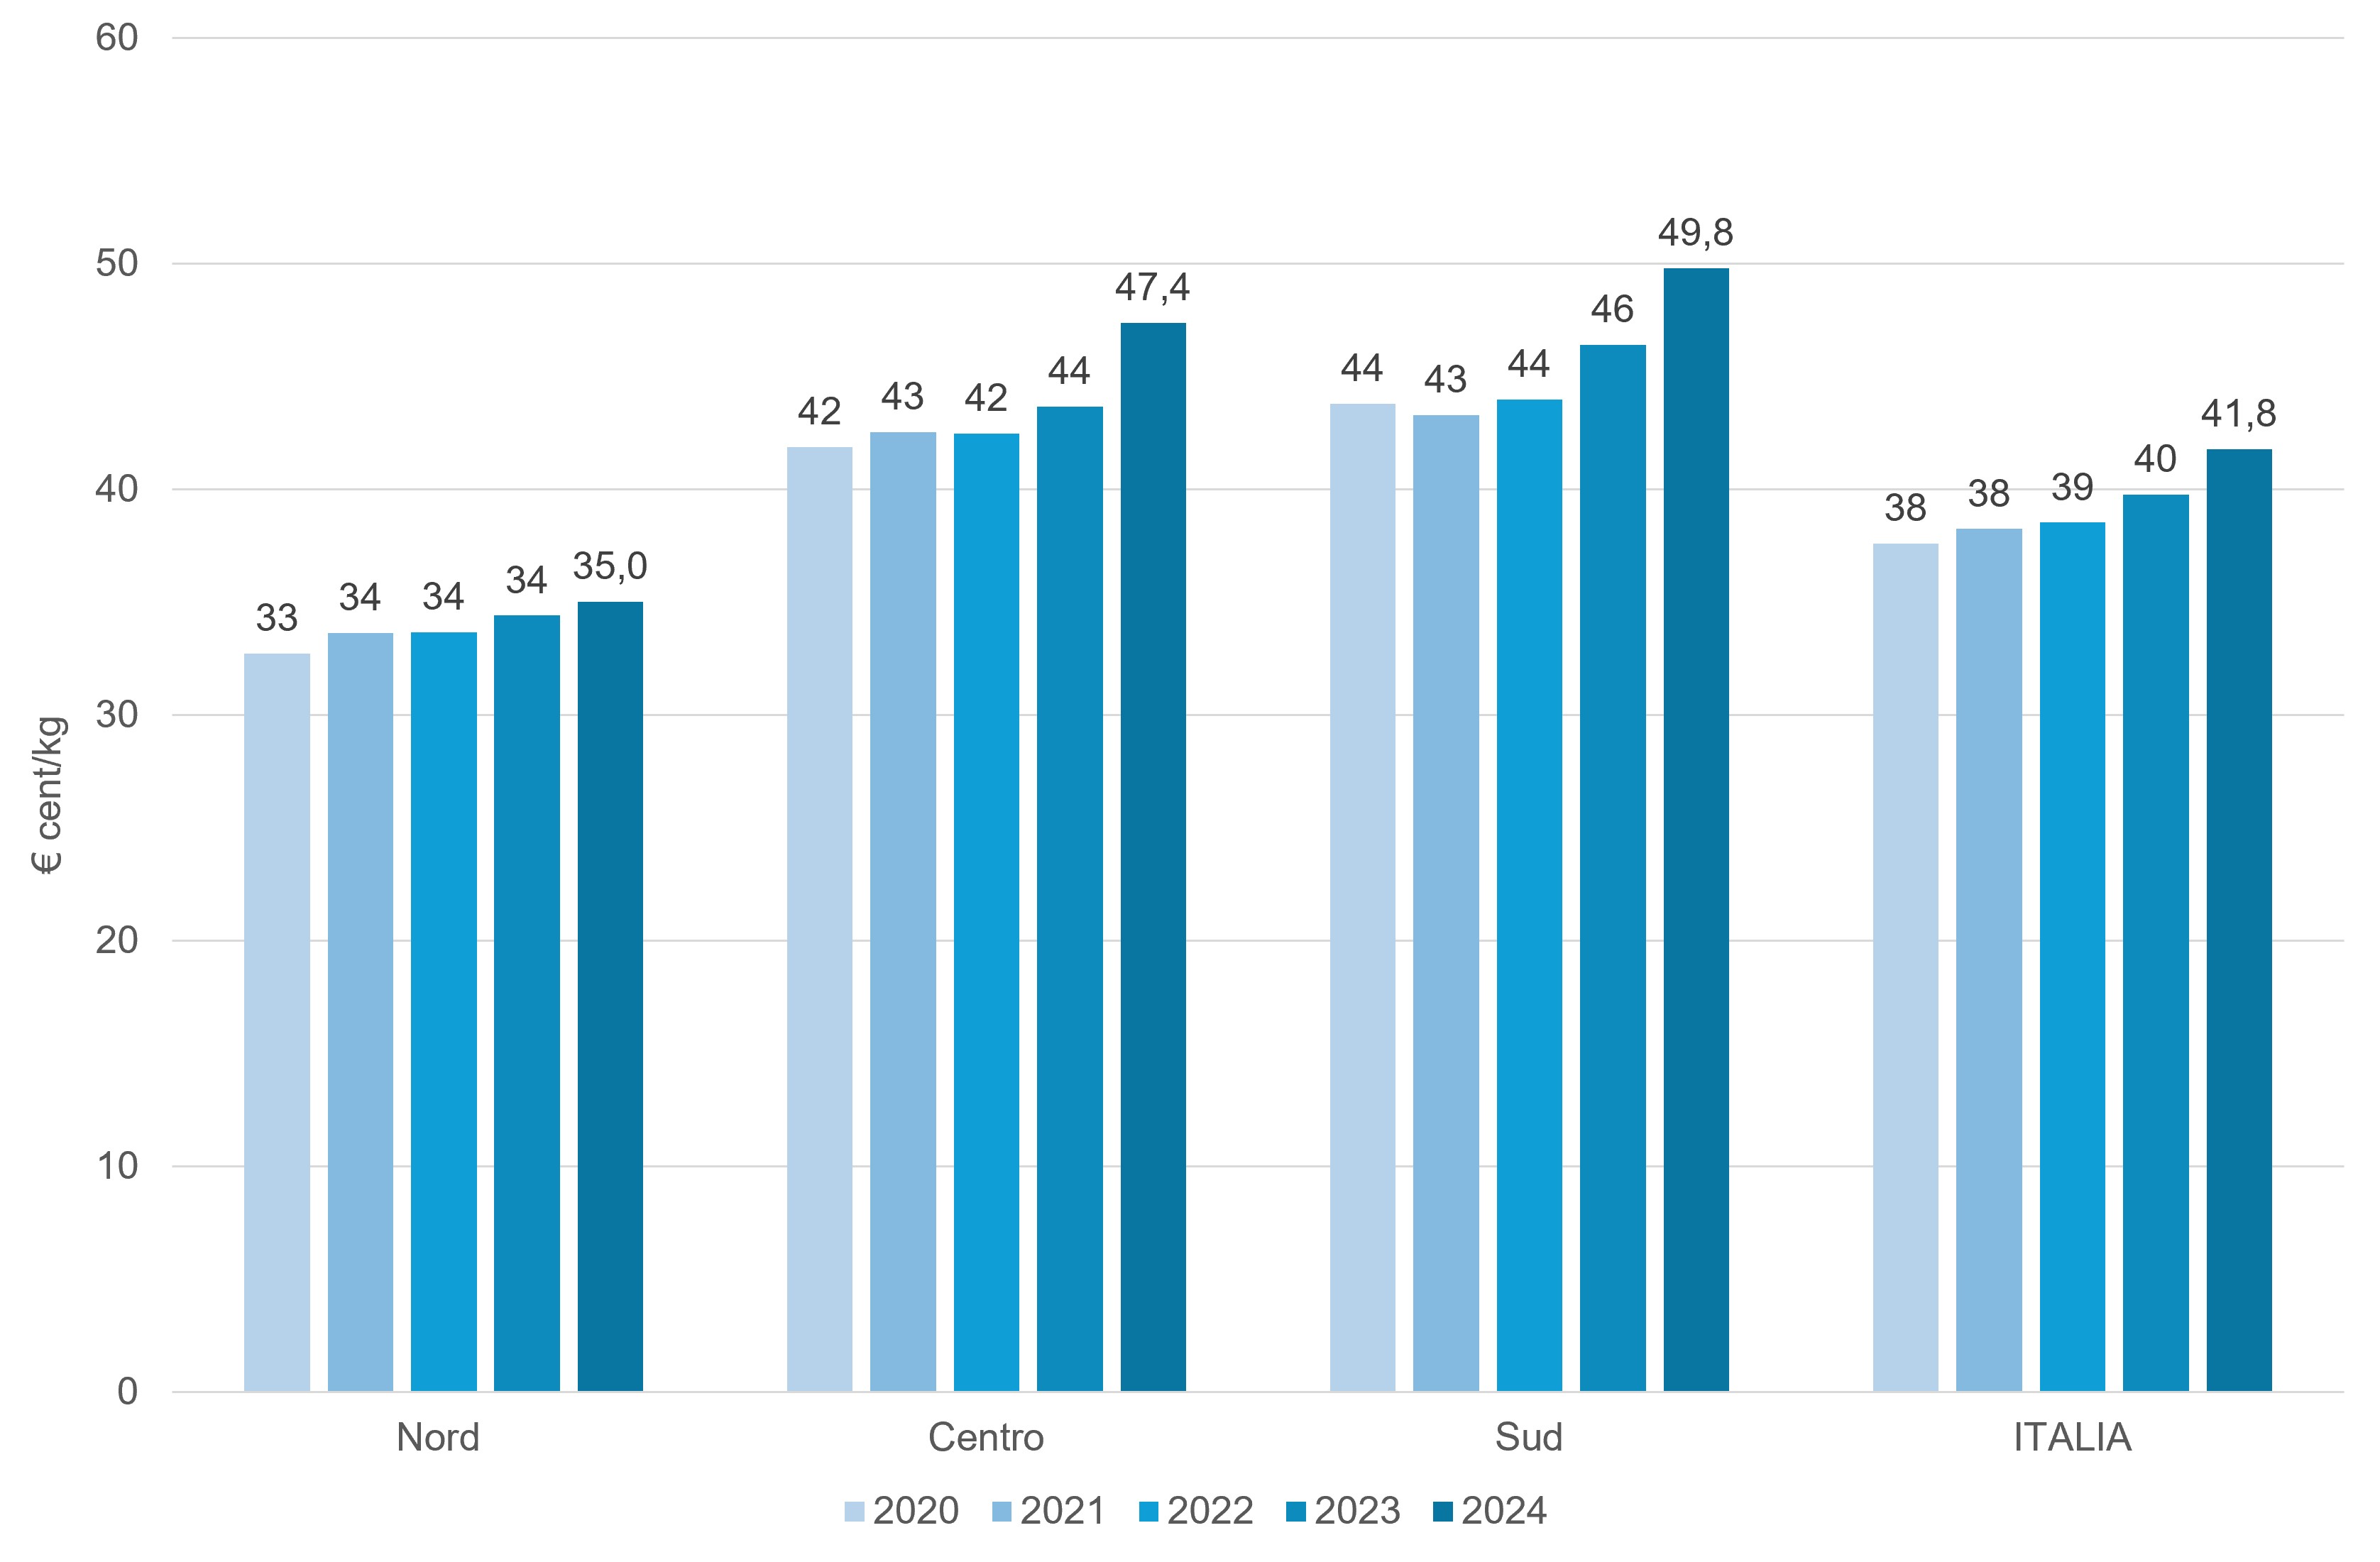
At macro-geographical area level, the total annual per capita cost of the service was highest in Central Italy, at EUR 256.6 per inhabitant, corresponding to 47.4 euro cents/kg, followed by Southern Italy, at EUR 229.2 per inhabitant, corresponding to 49.8 euro cents/kg, and Northern Italy, at EUR 187.2 per inhabitant, corresponding to 35.0 euro cents/kg.
The indicator measures the national average management cost of the urban sanitation service incurred by municipalities, expressed per inhabitant and per kg of waste. The data analysis is carried out on a sample of municipalities, which in 2024 comprised 6,770 municipalities, with a coverage rate of 85.7%.
To assess the effectiveness of municipal waste management policies through the analysis of costs incurred, taking into account the contribution of revenues from the sale of energy and recovered materials.
Legislative Decree No. 152/2006, Article 238, paragraph 1, provides that any person who owns or holds, for any reason, premises or uncovered areas used for private or public purposes, not constituting accessories or appurtenances of the same premises, whatever their use, located within municipal areas and generating municipal waste, is required to pay a tariff. The tariff constitutes the consideration for the provision of the collection, recovery and disposal service for municipal solid waste.
Presidential Decree No. 158/1999 is a regulation laying down rules for the development of the standardised method used to define the tariff for the municipal waste management service.
Law No. 205 of 2017, Article 1, paragraph 527, assigned to the Italian Regulatory Authority for Energy, Networks and Environment (ARERA) regulatory and control functions in the field of municipal and similar waste. By Resolution No. 443/2019, the Authority adopted the Waste Tariff Method, MTR, setting out the criteria for recognising efficient operating and investment costs of the integrated waste management service for the period 2018-2021. Subsequently, by Resolution No. 363/2021, the Authority adopted the Waste Tariff Method, MTR-2, for the second regulatory period 2022-2025.
Rapporto Rifiuti Urbani - 2025 Edition
ISPRA, Italian Institute for Environmental Protection and Research.
Single Environmental Declaration Model MUD ISPRA - Catasto Rifiuti ( https://www. catasto-rifiuti. isprambiente. it )
National, regional
2020-2024
The indicator is constructed by summing the costs of the individual items reported in the CG form, Management Costs, of the “Municipal Waste Communication” section of the MUD, submitted annually by the obligated entities, including municipalities, their consortia, unions of municipalities and other public and private operators. This value is then related to the population and to the quantity of municipal waste generated.
The CG forms are checked individually in order to obtain a sample of municipalities that is representative at national level.
In 2024, the average annual management cost was EUR 214.4 per inhabitant (+8.8% compared with 2023) and 41.8 euro cents/kg (+4.9% compared with 2023) (Tables 1 and 2).
Between 2020 and 2024, the cost per inhabitant increased (+15.5%) more than the per capita quantity of municipal waste generated over the same period (+11.1%) (Tables 1 and 2).
| Allegati |
|---|
Thumbnail
Titolo
Figure 1: National and macro-area average cost incurred by municipalities for the provision of urban sanitation services, per inhabitant Fonte
ISPRA processing based on ISPRA and Istat data. |
Thumbnail
Titolo
Figure 2: National and macro-area average cost incurred by municipalities for the provision of urban sanitation services, per kilogram of municipal waste generated Fonte
ISPRA Legenda
€ cents/kg = euro cents per kilogram. |
Thumbnail
Titolo
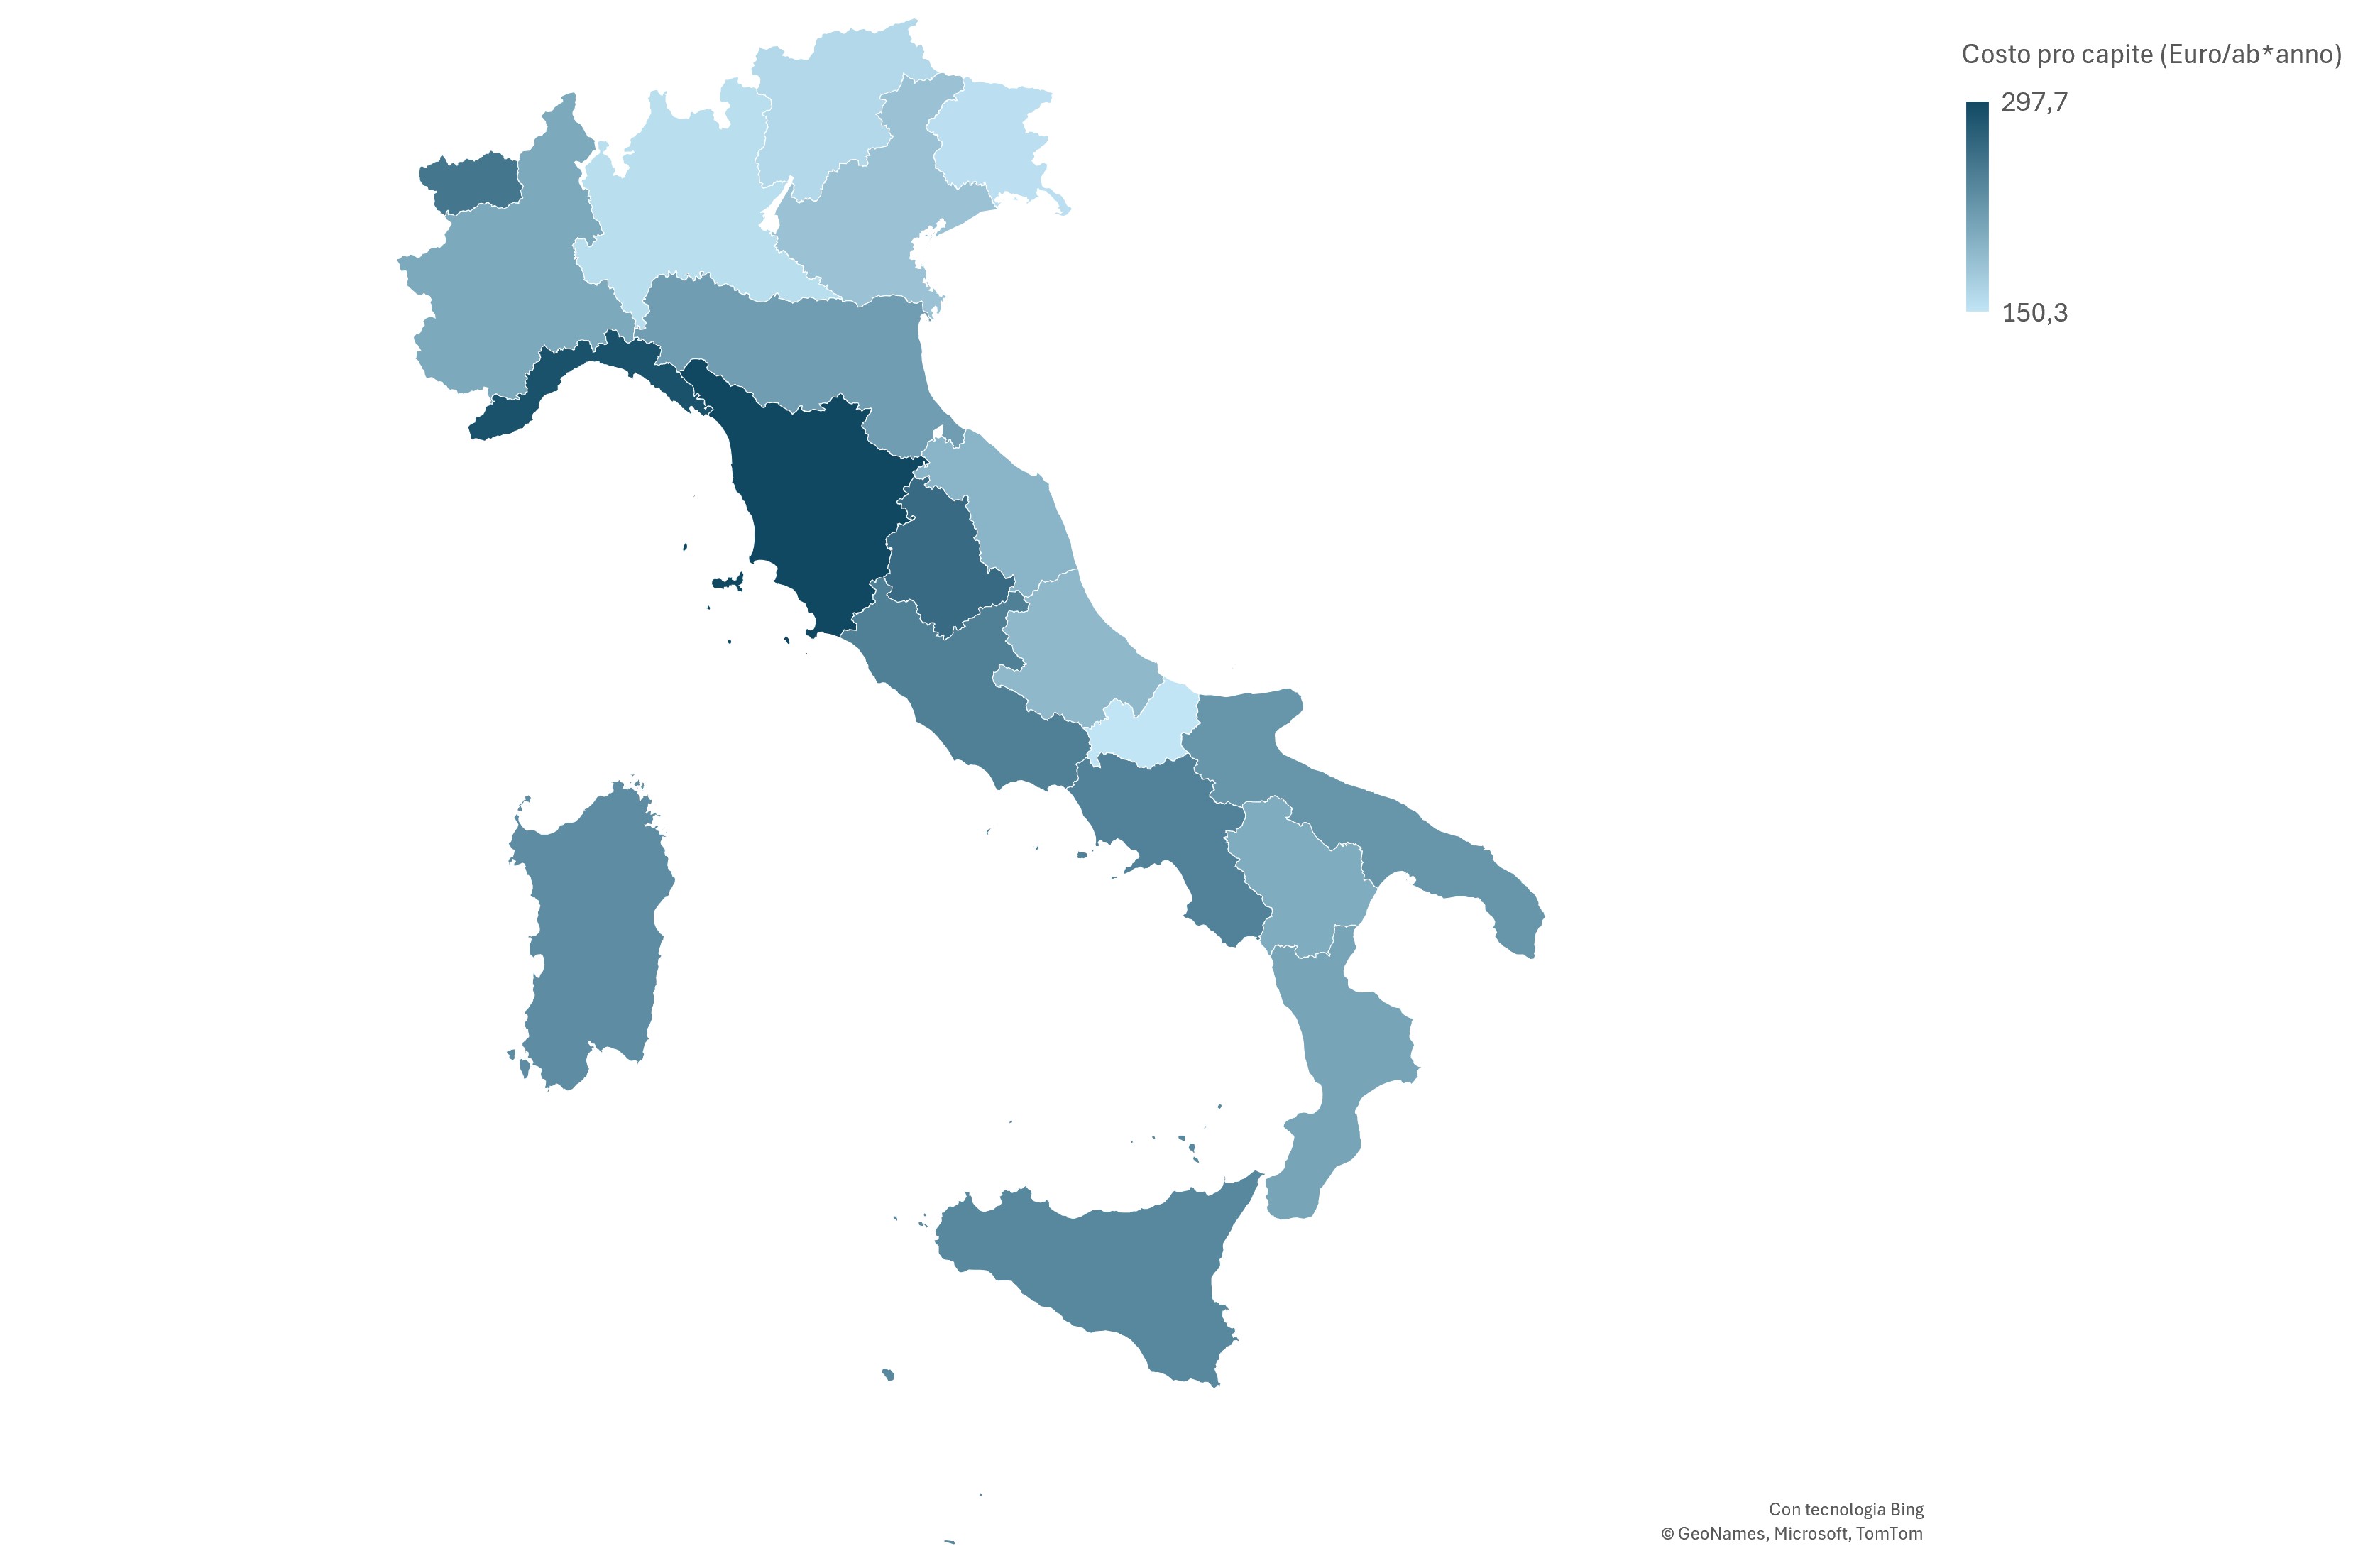
Figure 3: Average regional per capita cost incurred by municipalities for the provision of urban sanitation services (2024) Fonte
ISPRA processing based on ISPRA and Istat data. |
Thumbnail
Titolo
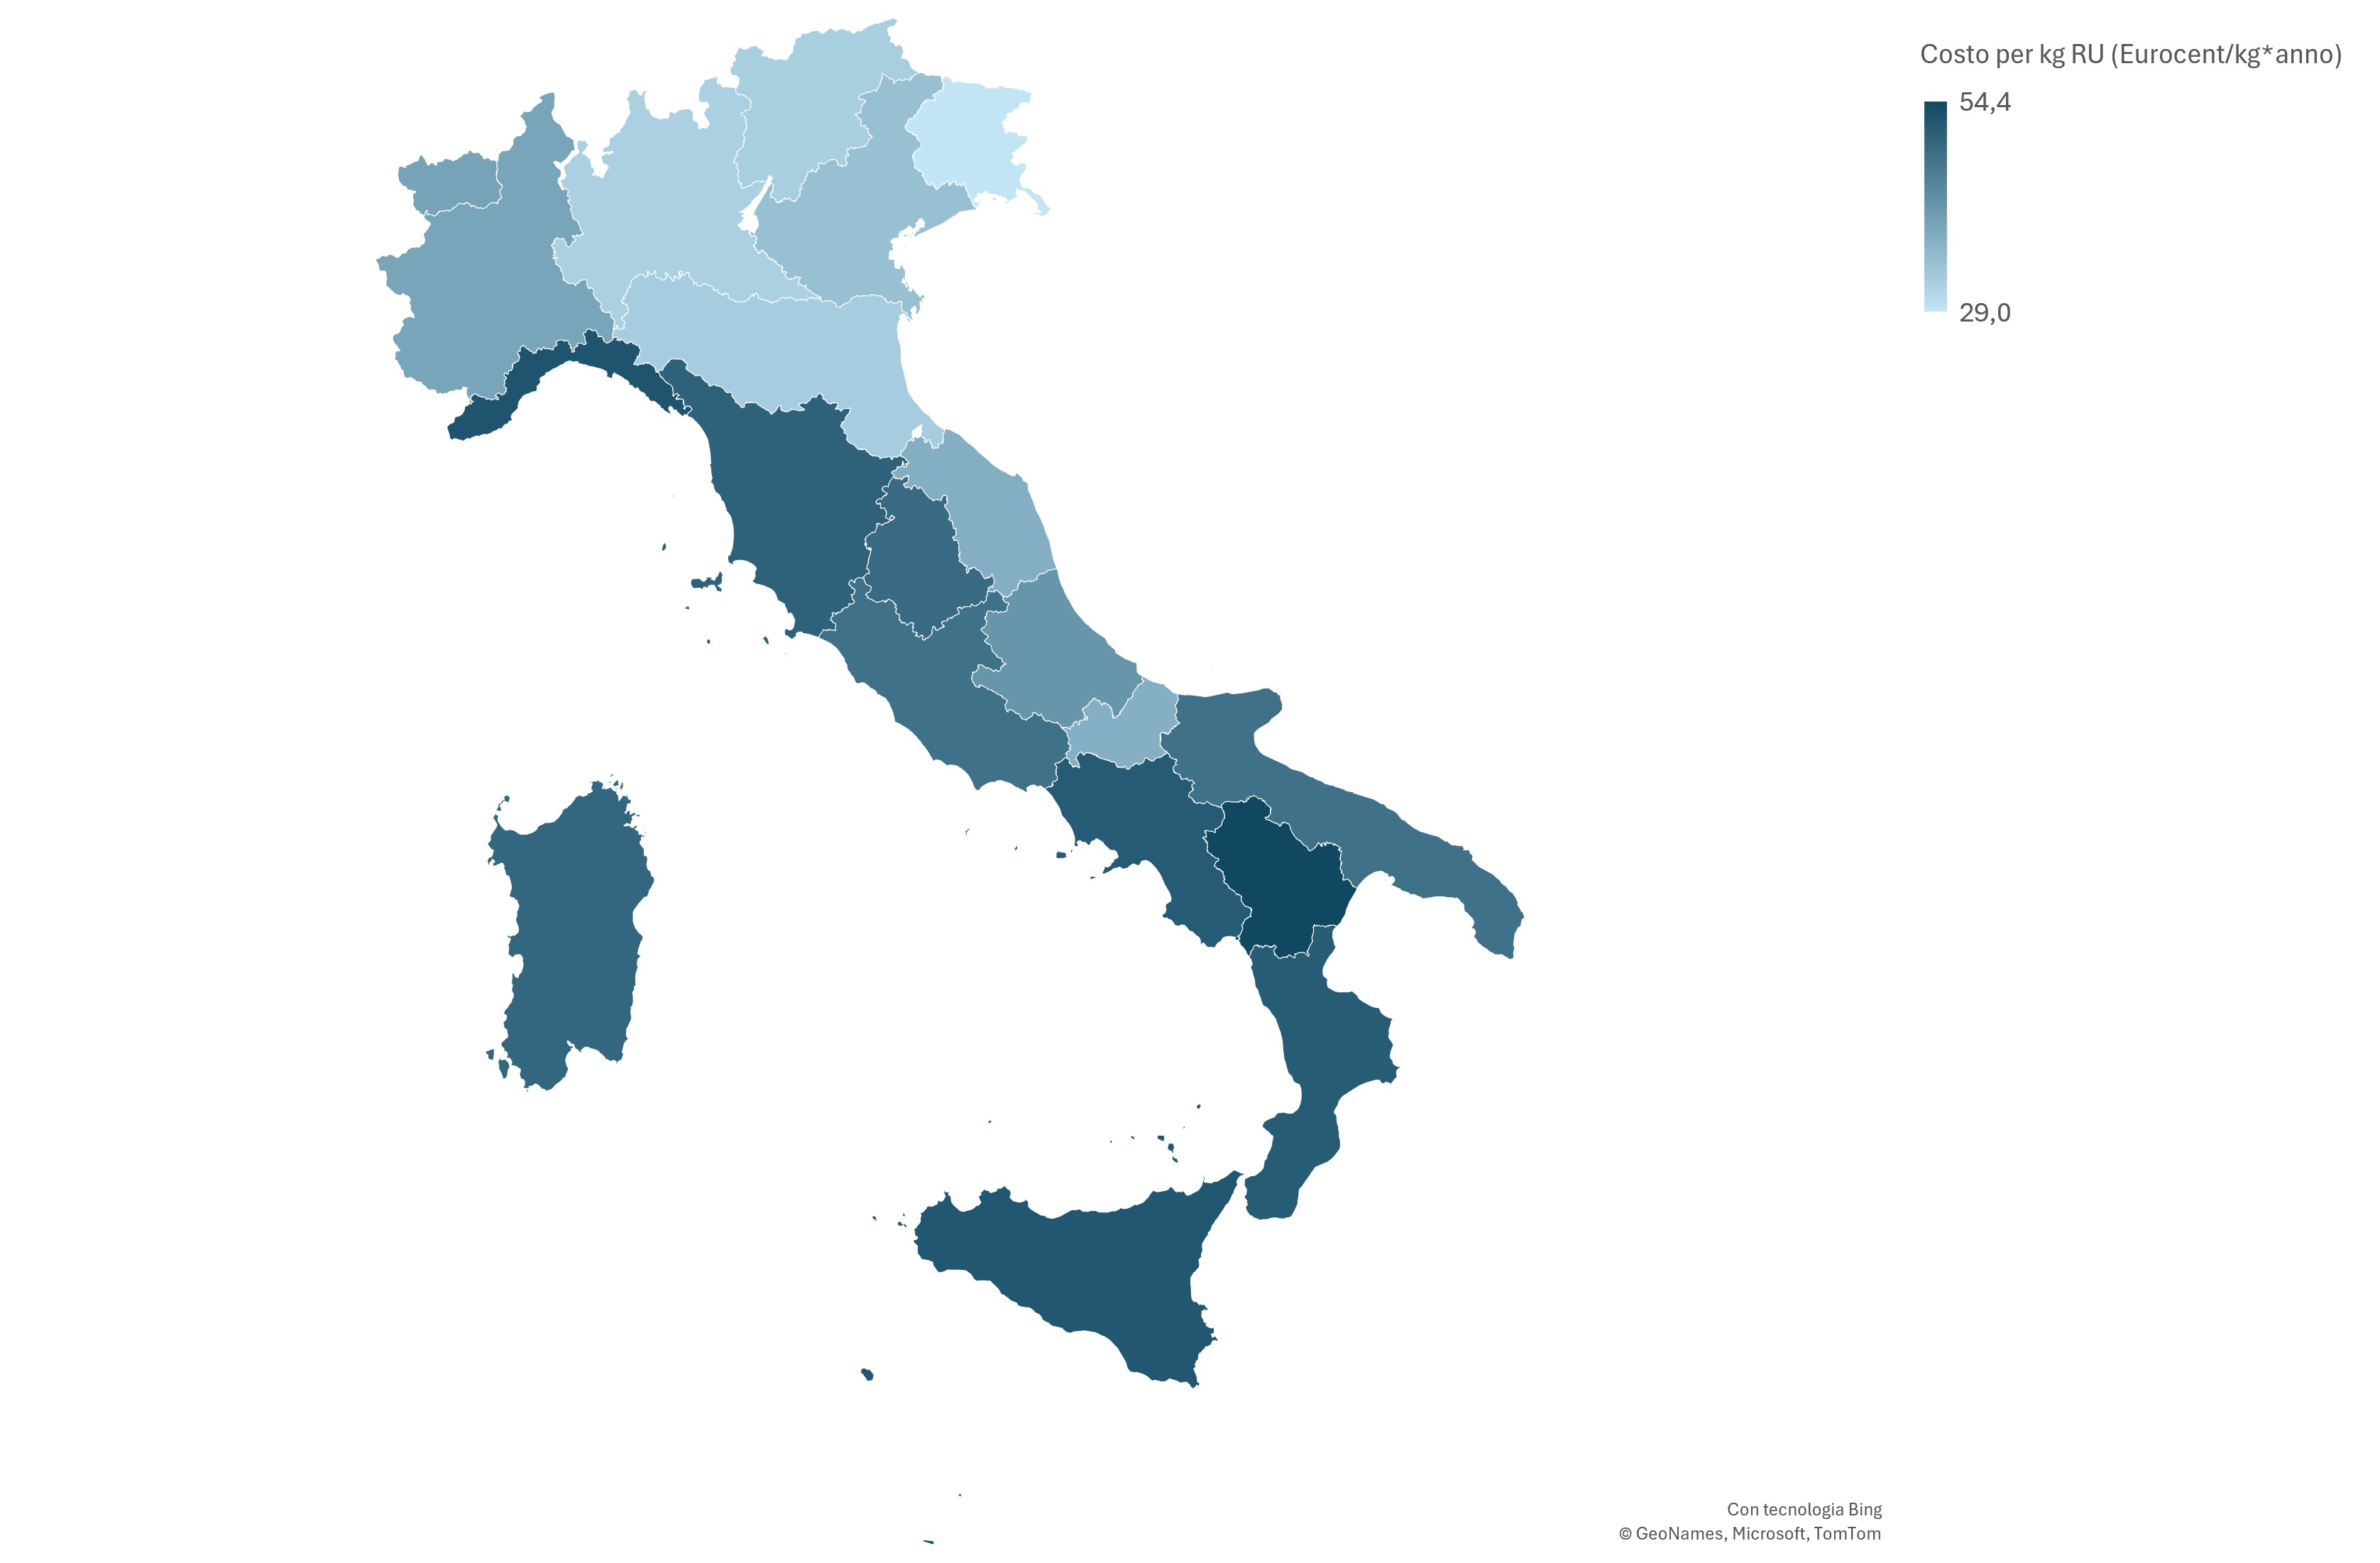
Figure 4: Average regional cost incurred by municipalities for the provision of urban sanitation services, per kilogram of municipal waste generated (2024) Fonte
ISPRA Legenda
€ cents/kg = euro cents per kilogram. |
Titolo
Table 1: Average regional per capita cost incurred by municipalities to provide the urban sanitation service Fonte
ISPRA |
Titolo
Table 2: Average regional cost per kilogram of municipal waste generated incurred by municipalities to provide the urban sanitation service Fonte
ISPRA Legenda
€ cents/kg = euro cents per kilogram. |
At macro-geographical area level, the total annual per capita cost of the service was highest in Central Italy, at EUR 256.6 per inhabitant, corresponding to 47.4 euro cents/kg, followed by Southern Italy, at EUR 229.2 per inhabitant, corresponding to 49.8 euro cents/kg, and Northern Italy, at EUR 187.2 per inhabitant, corresponding to 35.0 euro cents/kg (Tables 1 and 2; Figures 1 and 2).
In the northern macro-area, the average cost per inhabitant was EUR 27.2 per inhabitant lower than the national average. By contrast, Central and Southern Italy showed average costs per inhabitant above the national average by EUR 42.2 per inhabitant and EUR 14.8 per inhabitant, respectively (Table 1). Similarly, the cost per quantity of waste generated was 6.8 euro cents/kg below the national average in the North, whereas in Central and Southern Italy it exceeded the national average by 5.6 euro cents/kg and 8.0 euro cents/kg, respectively.
It should be noted that the costs incurred by municipalities for municipal waste management are influenced by several factors, including, for example, the distance from treatment and disposal facilities, also in relation to the orographic position of the municipality, as well as tourist inflows. Cost analysis showed that municipalities with a strong tourism vocation have higher service management costs than the national average. For islands, particularly smaller islands, a higher incidence of costs related to transport, necessarily by sea, and to distance from treatment facilities was also observed.
In the northern macro-area, the highest per capita costs were recorded in Liguria, at EUR 288.3 per inhabitant, corresponding to 52.4 euro cents/kg. In Central Italy, the highest cost was recorded in Tuscany, at EUR 297.7 per inhabitant, which was also the highest per capita cost at national level, corresponding to 50.1 euro cents/kg. In Southern Italy, the highest cost was recorded in Campania, at EUR 242.9 per inhabitant, corresponding to 51.3 euro cents/kg (Figures 3 and 4).
The lowest per capita costs were recorded in Friuli-Venezia Giulia in the North, at EUR 155.4 per inhabitant, corresponding to 29.0 euro cents/kg; in Marche in the Centre, at EUR 196.1 per inhabitant, corresponding to 37.7 euro cents/kg; and in Molise in the South, at EUR 150.3 per inhabitant, corresponding to 37.5 euro cents/kg (Figures 3 and 4).