Roberto Daffinà, Giovanni Finocchiaro
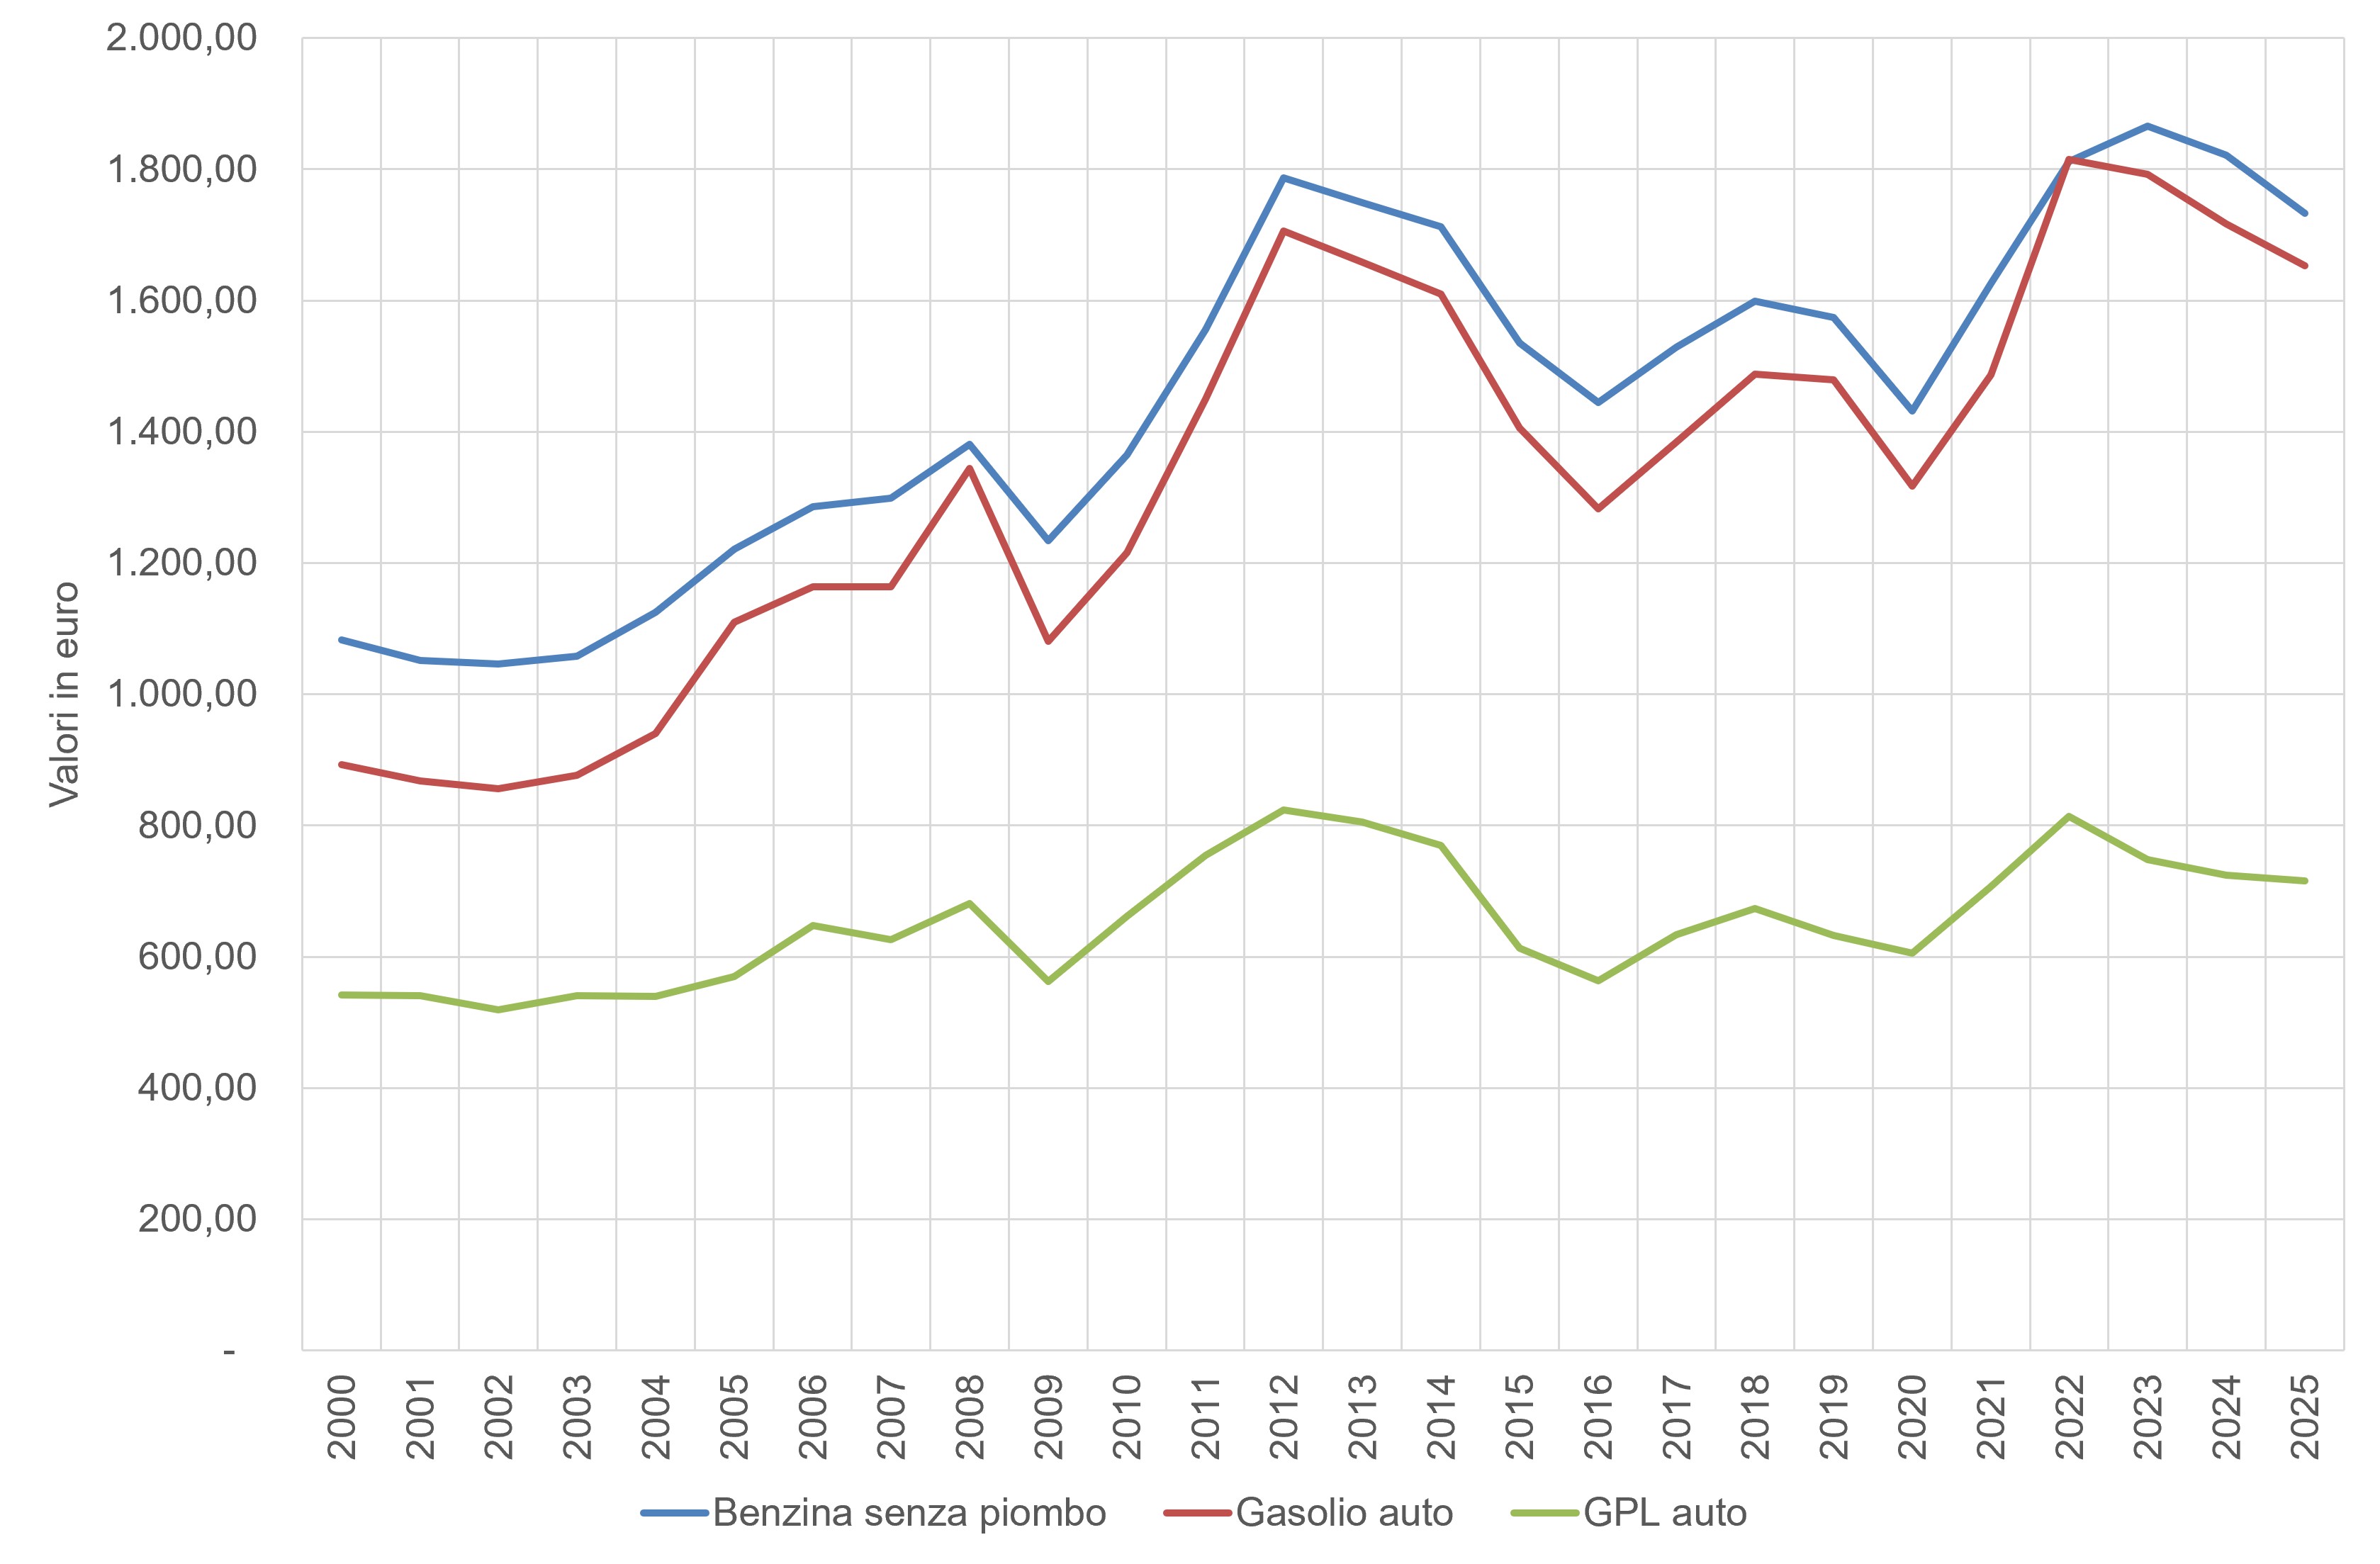
The indicator describes the dynamics of transport prices (passengers and goods), highlighting the evolution over time of this important determinant of transport demand and its modal split. The average national consumer prices of petroleum products used for transport, expressed as annual average values, in the period 2000-2025 show considerable increases: approximately 60% for petrol, approximately 85% for automotive diesel, approximately 32% for automotive LPG. For 2025 there is a countertrend compared to the previous year with reductions, respectively, of 5.4% and 1% for the three types of petroleum products considered.
The prices of transport services, determined by autonomous market dynamics, are also influenced by public intervention through taxation, infrastructure provision, subsidies, regulation and territorial planning. Their evolution over time affects the demand for transport and the modal split: given a certain travel budget, a decrease in transport prices makes it possible to travel more (so-called rebound ) and, if this happens only for some modes of transport, as in fact happens for road and air transport, these attract a greater share of traffic. Transport demand and modal split, in turn, influence the environmental impact of the transport sector. An important component of transport prices is represented by fuel prices which impact fuel demand and transport.
Describe the dynamics of passenger and freight transport prices, highlighting the evolution over time of this determinant of transport demand and its modal split.
The 2011 White Paper on Transport (COM(2011) 144) has been the compass of European mobility for years, but the European Union's transport policy has undergone an extraordinary acceleration to align with the objectives of the European Green Deal.
If the 2011 White Paper aimed for a 60% reduction in greenhouse gas emissions by 2050, today the target has been updated to a much more ambitious -90% of emissions in transport by 2050, in order to achieve global climate neutrality.
The New Strategy for Sustainable and Intelligent Mobility (COM(2020) 789) adopted at the end of 2020, represents the actual "software update" of the old White Paper. It has redefined the creation of the single European transport area by setting much more stringent intermediate stages. The three objectives to be achieved by 2030 are to have at least 30 million zero-emission cars in circulation and the doubling of high-speed rail traffic. Entro il 2035: Ingresso sul mercato di navi e aerei di grandi dimensioni a emissioni zero e stop alla vendita di nuove auto e furgoni con motori a combustione interna (benzina e diesel). Finally, by 2050, an almost total transition towards zero-emission vehicles for all sectors (including heavy vehicles) and the doubling of rail freight traffic.
Tax legislation is moving in parallel. La proposta di revisione della Direttiva sulla tassazione dell'energia mira a superare le distorsioni storiche tassando i carburanti non più in base al volume (litri), bensì in base al loro contenuto energetico e alle prestazioni ambientali. This approach aims to eliminate the tax advantages that traditional fossil fuels have enjoyed so far in favor of electricity, hydrogen and advanced biofuels.
Effective transport pricing is one of the main ways to achieve the Community objective of making transport more sustainable; transport prices, in fact, are often poorly correlated with the true costs that they impose on society and therefore do not send citizens the right signals to decide how much and how to move.
To make this happen it is necessary to "internalise external costs", i. e. Ensure that transport users pay for the negative externalities (environmental impacts, accidents, congestion) generated by their mobility behaviour.
Ministry of the Environment and Energy Security, https://sisen. mase. gov. it/dgsaie/open-data
Istat, Consumer price indices, https://esploradati. istat. it/databrowser/
European Commission, https://energy. ec. europa. eu/data-and-analysis/weekly-oil-bulletin_en
National
2000-2025
Istat calculates consumer price indices (NIC, FOI and IPCA) using the Laspeyres chain index, a methodology that annually updates both the basket of goods and the weight system to intercept real changes in the population's consumption. Da gennaio 2016, in conformità con il Regolamento quadro europeo, tali indici sono strutturati secondo la classificazione standardizzata ECOICOP. Questo impianto metodologico inserisce le spese per la mobilità all'interno della specifica "Divisione 07 - Trasporti", consentendo di disaggregare con precisione la spesa monetaria delle famiglie tra l'acquisto di veicoli (07.1), i costi di utilizzo privato come i carburanti (07.2) e i servizi di trasporto pubblico (07.3). At the same time, the national average prices of petroleum products are recorded by the Ministry of Economic Development (now MIMIT) according to strict community criteria. L'integrazione di queste fonti statistiche e amministrative armonizzate permette di monitorare l'evoluzione dei costi di trasporto a livello nazionale ed europeo, offrendo la base quantitativa necessaria per analizzare l'accessibilità economica della mobilità e l'impatto dei rincari energetici sui bilanci familiari.
Table 1 shows that, in 2025, the product groups of the transport division "Transport Services" recorded positive changes compared to the previous year (2.6%), while for the groups "Operating costs for transport vehicles" (-0.7%) and "Transport" (-0.3%) there was a negative change.
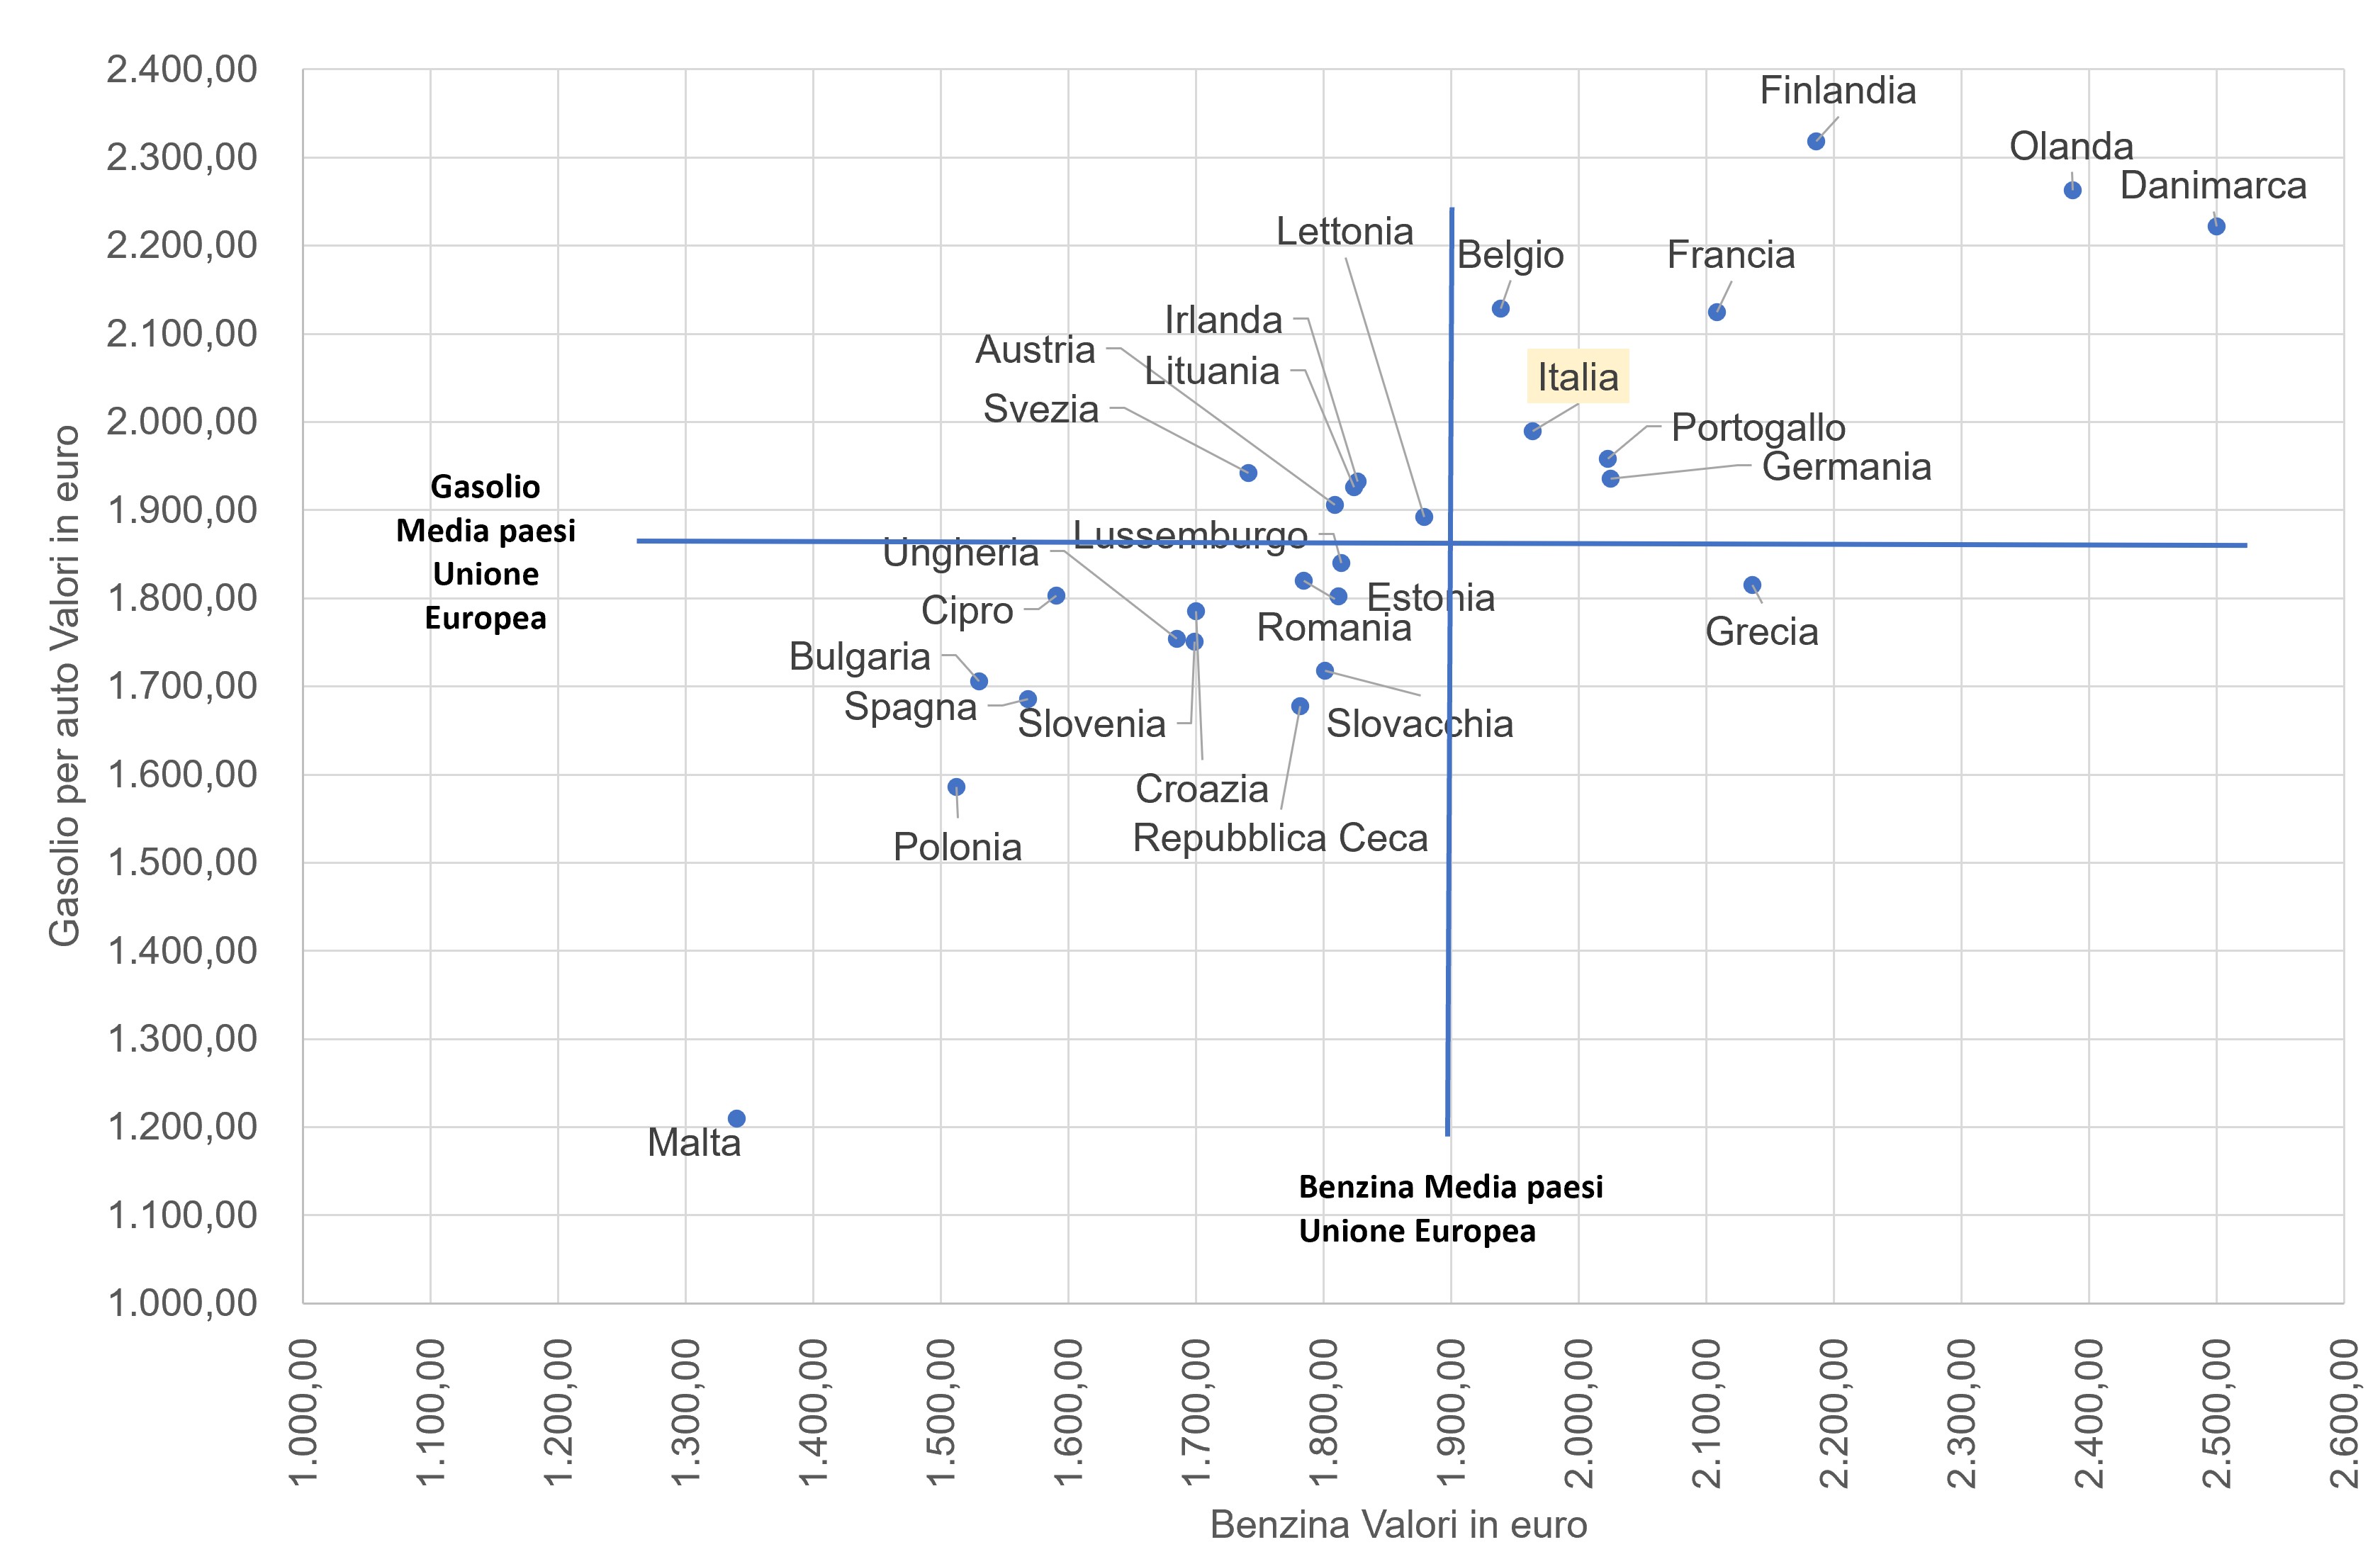
Detailed comparative analysis between prices in Italy and the average of the European Union and Euro Area countries. It is highlighted that Italy records prices higher than the continental average for both petrol (€1,963.96/1,000 litres) and diesel (€1,989.32/1,000 litres), positioning itself among the countries with the highest transport burden, only partially offset by a price of automotive LPG (€820.36/1,000 litres) lower than the European average.
I prezzi medi nazionali al consumo dei prodotti petroliferi utilizzati per il trasporto, nel periodo 2000-2025 mostrano aumenti considerevoli: +60% per la benzina, +85% per il gasolio auto e +32% per il GPL auto. Compared to the previous year, in 2025 the average national consumer price of unleaded petrol fell by 5%, that of diesel for cars by 4% and that of auto LPG by 1%. (Figura 1). These increases in the prices of petroleum products are attributable to the trend in international crude oil prices.
| Allegati |
|---|
Thumbnail
Headline
Figure 1: National average annual consumer prices (per 1,000 liters) of petroleum products used for transport Data source
ISPRA processing of data from the Ministry of Environment and Energy Security (MASE) |
Thumbnail
Headline
Figure 2: Consumer prices (per 1,000 liters) of petrol and diesel for cars in European Union countries Data source
ISPRA processing of data from the Ministry of Environment and Energy Security (MASE) |
Headline
Table 1: Consumer price index for transport Data source
ISPRA processing of data from the Ministry of Environment and Energy Security (MASE) |
Istat has changed the reference base of the consumer price indices for the entire community (NIC) which are now expressed in the new base year 2015=100. In 2025 the consumer price index for transport is equal to 123.5 (-0.3% compared to the previous year) compared to a general index of 122.6 (Table 1). Analyzing the individual items, strong increases are recorded for the categories relating to "Passenger air transport" equal to 230.3 (+6.6% compared to the previous year) and "Maritime and inland waterway transport 149.1 (+11.5 compared to 2024). The category that grows the least over time is that relating to "Insurance on means of transport" (113.8) with a significant increase of 5.7% in the last year. The consumer prices of petroleum products used for transport, expressed as average annual values for 2025, equal to 1.732 euros/litre (1.821 in 2024) for unleaded petrol, 1.652 euros/litre (1.716 in 2024) for automotive diesel and 0.715 euros/litre (0.724 in 2024) for LPG. Cars, were lower than the previous year (Figure 1). The comparison between the prices of EU countries (recorded on 25 May 2026) shows that Italy is in eighth place in Europe (EU 28) for the consumer price of unleaded petrol and in sixth place for the price of car diesel (Figure 2), both products are more expensive in Denmark, the Netherlands, Finland and France while if only the cost of petrol is considered the cost is also higher in Greece, Germany and Portugal and for diesel alone there is a higher cost in Belgium.