Francesca Archi, Francesca Piva
The indicator provides a national-level picture of the types of pressures acting on surface and groundwater bodies. This information derives from the reporting of the 3rd Water Management Plans drawn up by the District Basin Authorities in accordance with the provisions of the Water Framework Directive 2000/60/EC (WFD) which requires an examination of the impact of human activities on the state of the waters to be carried out. From the analysis of the data it is observed that the main type of pressure that impacts both categories of water, surface and underground, is that of the diffuse type for agricultural use. Subsequently, surface water bodies are impacted by hydromorphological pressure while underground water bodies are impacted by withdrawals.
The indicator describes the main types of significant pressure affecting surface and underground water bodies. A pressure is defined as "significant" if alone, or in combination with others, it contributes to an impact (a worsening of the state) which can put at risk the achievement of the environmental objectives referred to in Article 4, paragraph 1, of the Framework Directive 2000/60/EC (WFD), which include the achievement of the good state, the non-deterioration of the state, the prevention of the tendency towards increasing pollution of groundwater and the achievement of the objectives for protected areas.
The types of pressure - punctual, widespread, withdrawal, hydromorphological, generic anthropic and unknown anthropic pressures - and the related determinants examined are those standardized at European level and reported in the WFD Reporting Guidance 2022, a European guideline which contains the technical specifications for reporting the information contained in the Management Plans.
Identify pressures acting on water bodies as an initial step in the planning process. Consequently, evaluate the associated risks to design monitoring programs whose aim is to determine the status of water bodies and validate the risk analysis.
Water Framework Directive 2000/60/EC
Legislative Decree 152/2006 and subsequent amendments.
The identification of significant pressures and consequent impacts is required by art. 5 of the DQA and the Italian transposition law of Legislative Decree 3 April 2006, n. 152 containing "Environmental regulations" and must be contained in the water management plans as it is necessary to carry out risk analysis on water bodies and evaluate the consequent achievement of the environmental objectives dictated by the aforementioned regulations.
SNPA – Guideline for pressure analysis pursuant to Directive 2000/60/EC, SNPA Guideline 11/2018
River basin district management plans - Documents relating to the analysis of pressures and impacts
CIS Guidance n.3 - Analysis of Pressures and Impacts
WFD reporting Guidance 2022
Basin Authorities, Autonomous Provinces, Regions
The River Basin District Management Plans contain the analysis of pressures and impacts on water bodies and the same information is reported at European level through WISE reporting. This information can be found in the Management Plans accessible on the websites of the District Basin Authorities and on the website of the European Environment Agency ( https://water. europa. eu/freshwater/countries/wfd/italy )
National, River basin districts
2015-2021
The calculations for calculating the indicator are expressed as a percentage. The percentages were calculated by referring to different aggregations depending on what was represented. In the figures showing the types of pressure by category of water body, the percentages are calculated with respect to the number of water bodies for each category. Similarly, where the types of pressure by district are represented, the percentages are calculated with respect to the number of water bodies belonging to each district.
The indicator provides an assessment of human impacts on surface and groundwater bodies. The prevailing pressures are widespread and in particular due to agricultural use for both categories of water. The hydromorphological pressures and punctual pressures due to urban discharges for surface water are lower, but still high, while for groundwater the punctual pressures - contaminated sites and the diffuse pressures due to run-off from urban surfaces are high.
It is not possible to express a judgment on the trend of the indicator since in the previous six-year period the analysis of pressures was carried out with different criteria.
| Data |
|---|
Thumbnail
Headline
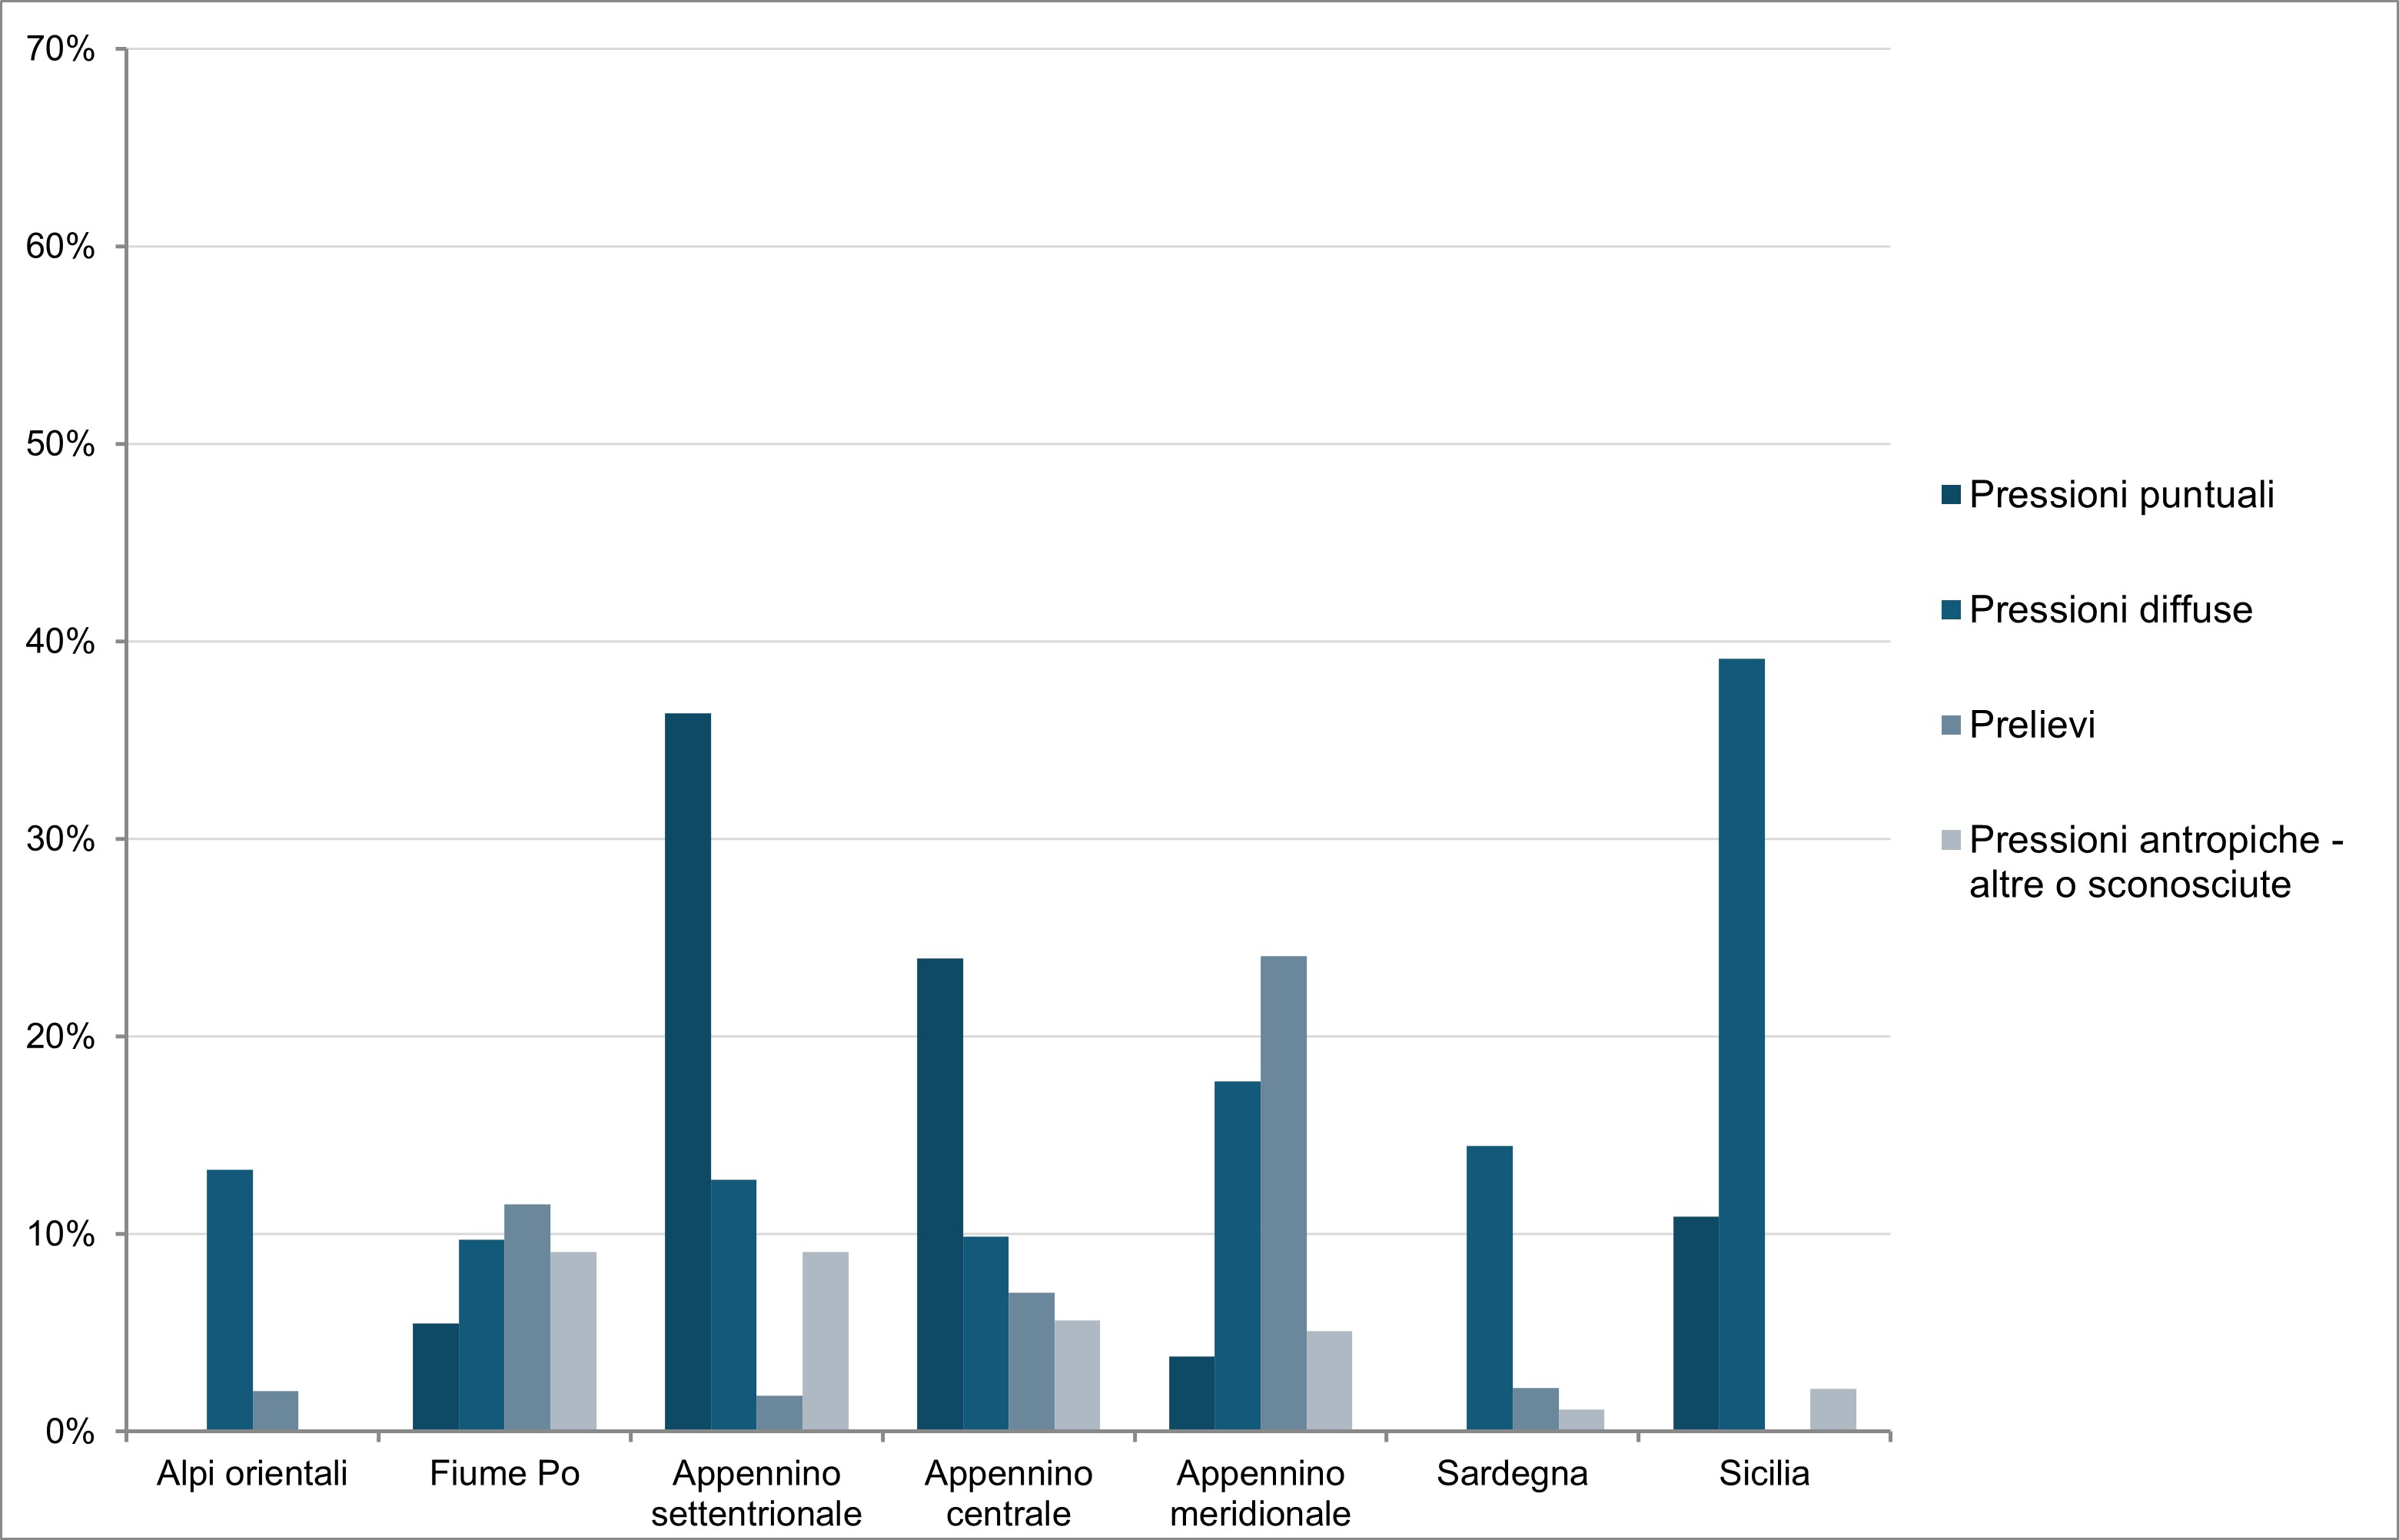
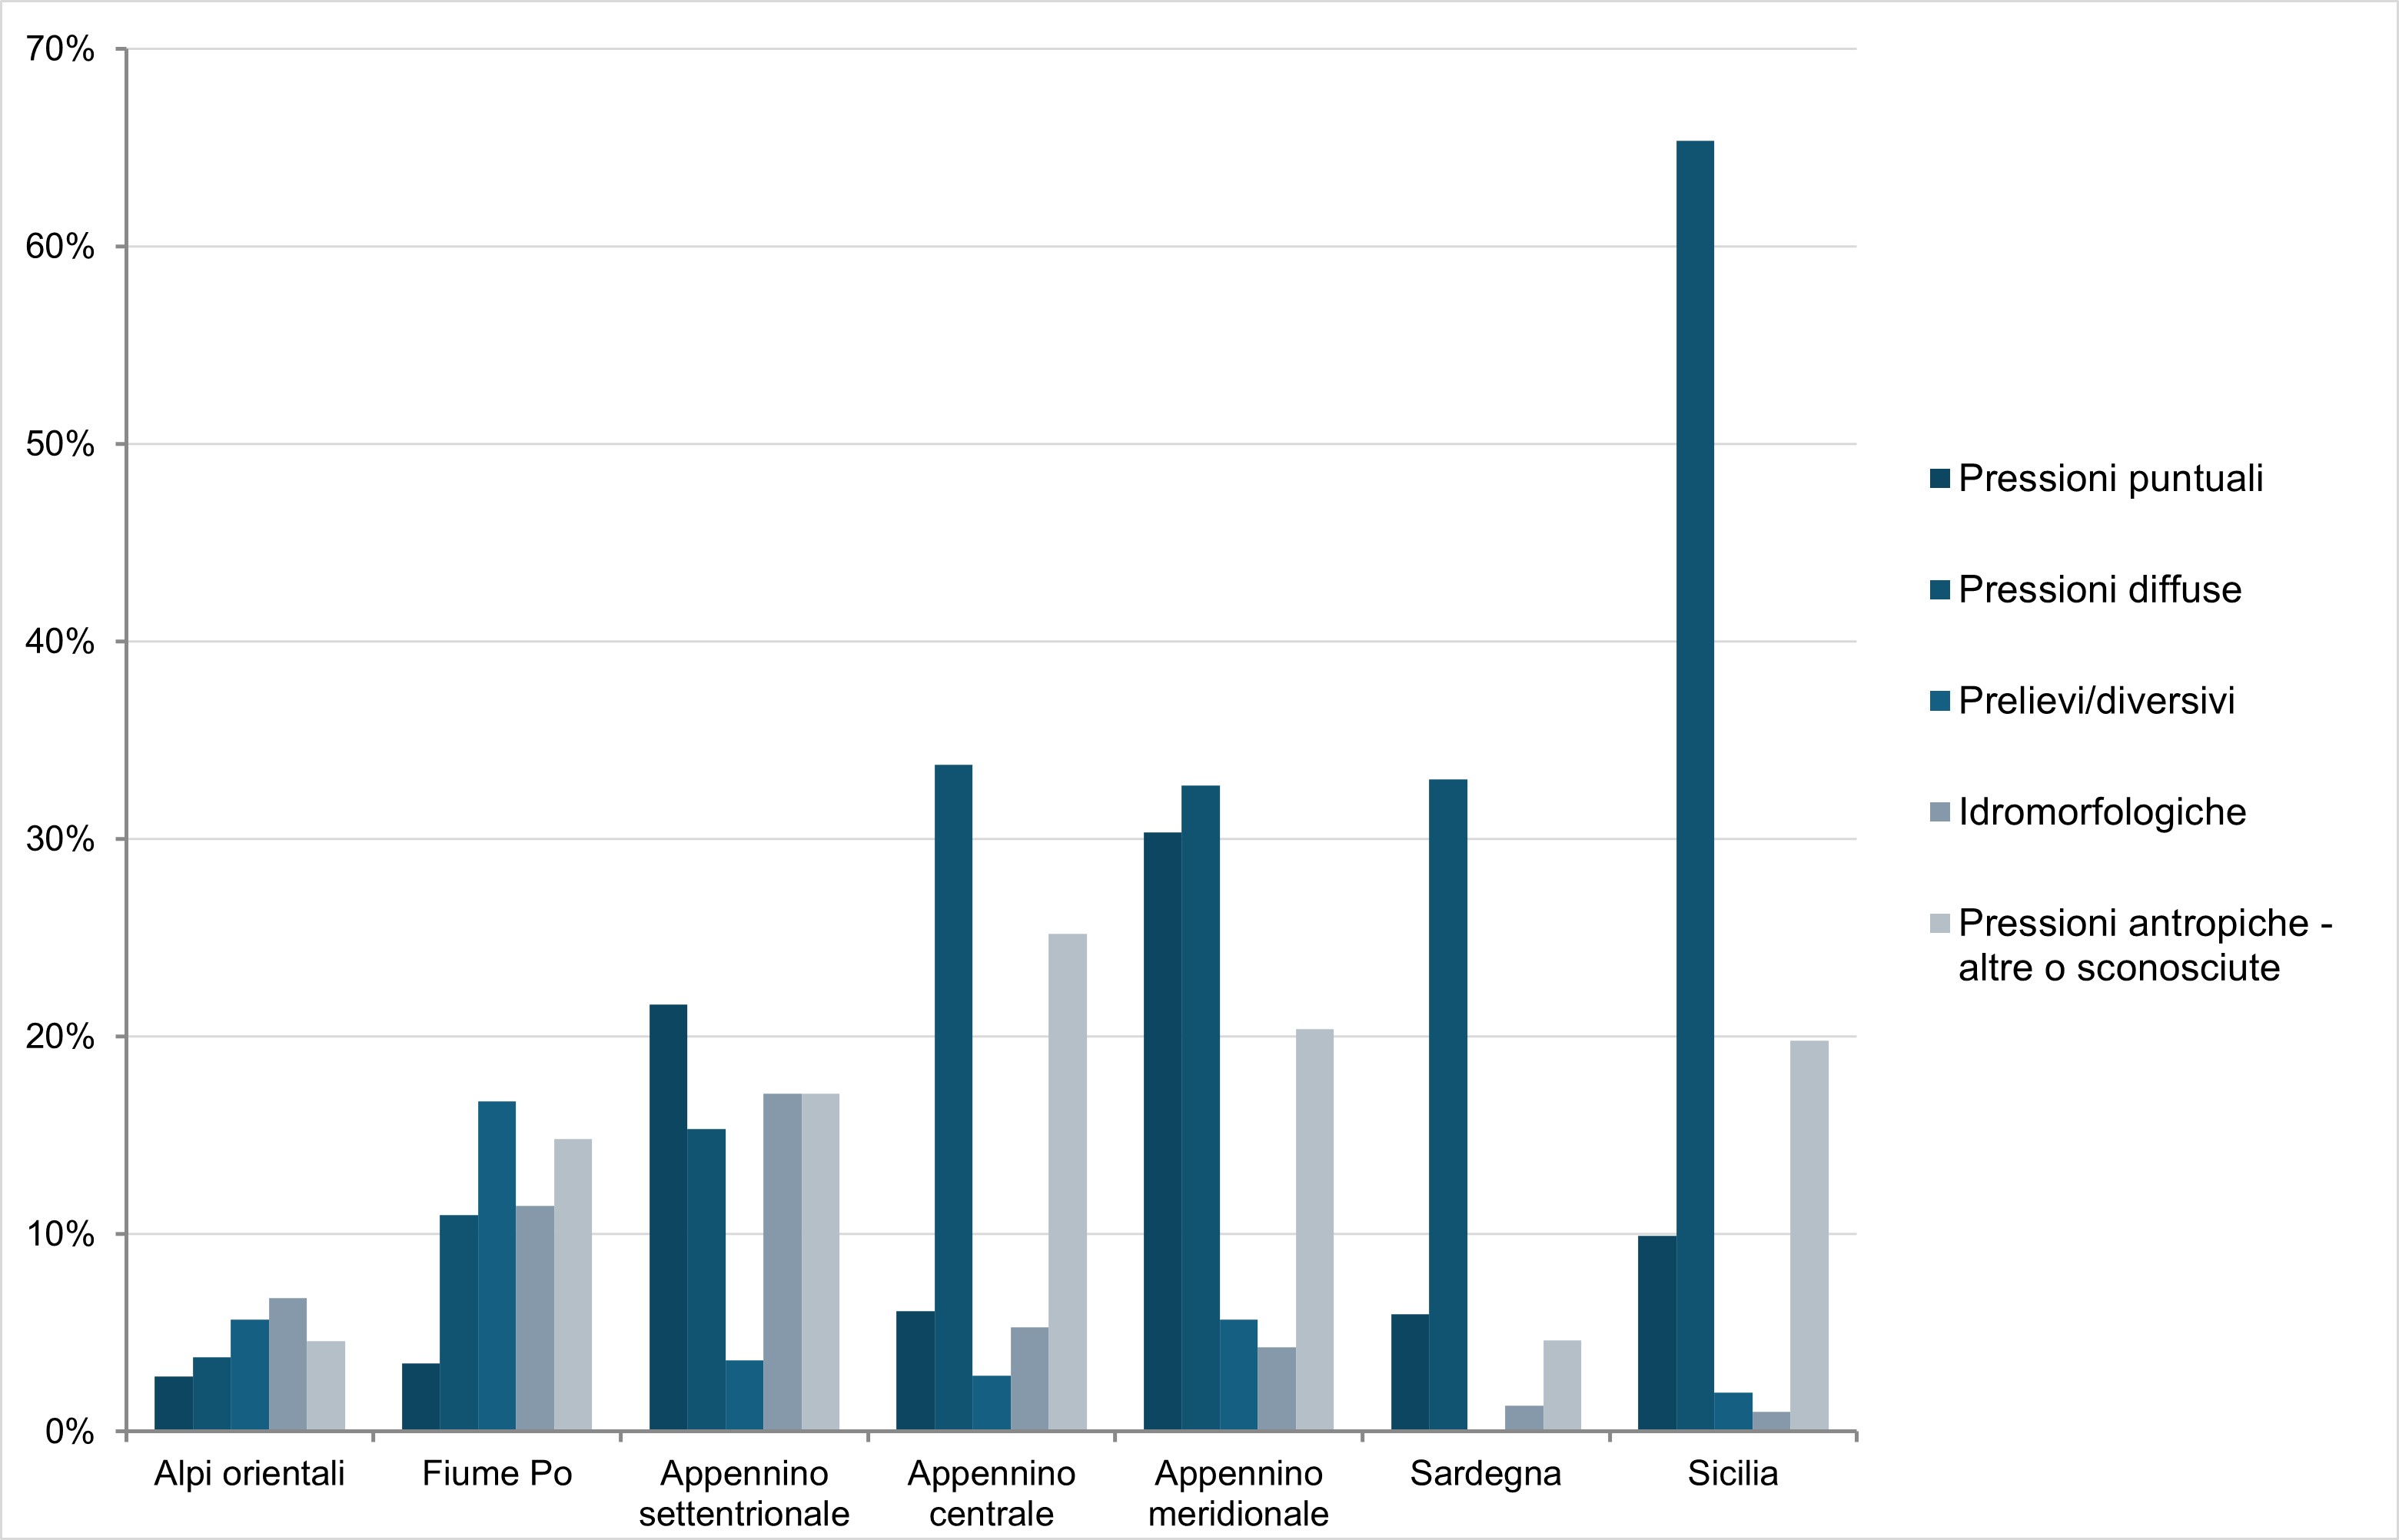
Figure 2b: Underground water bodies - Distribution of prevailing significant pressures by district Data source
ISPRA processing on WISE 2022 reporting data Note
Only underground water bodies impacted by a single type of pressure were taken into account |
Thumbnail
Headline
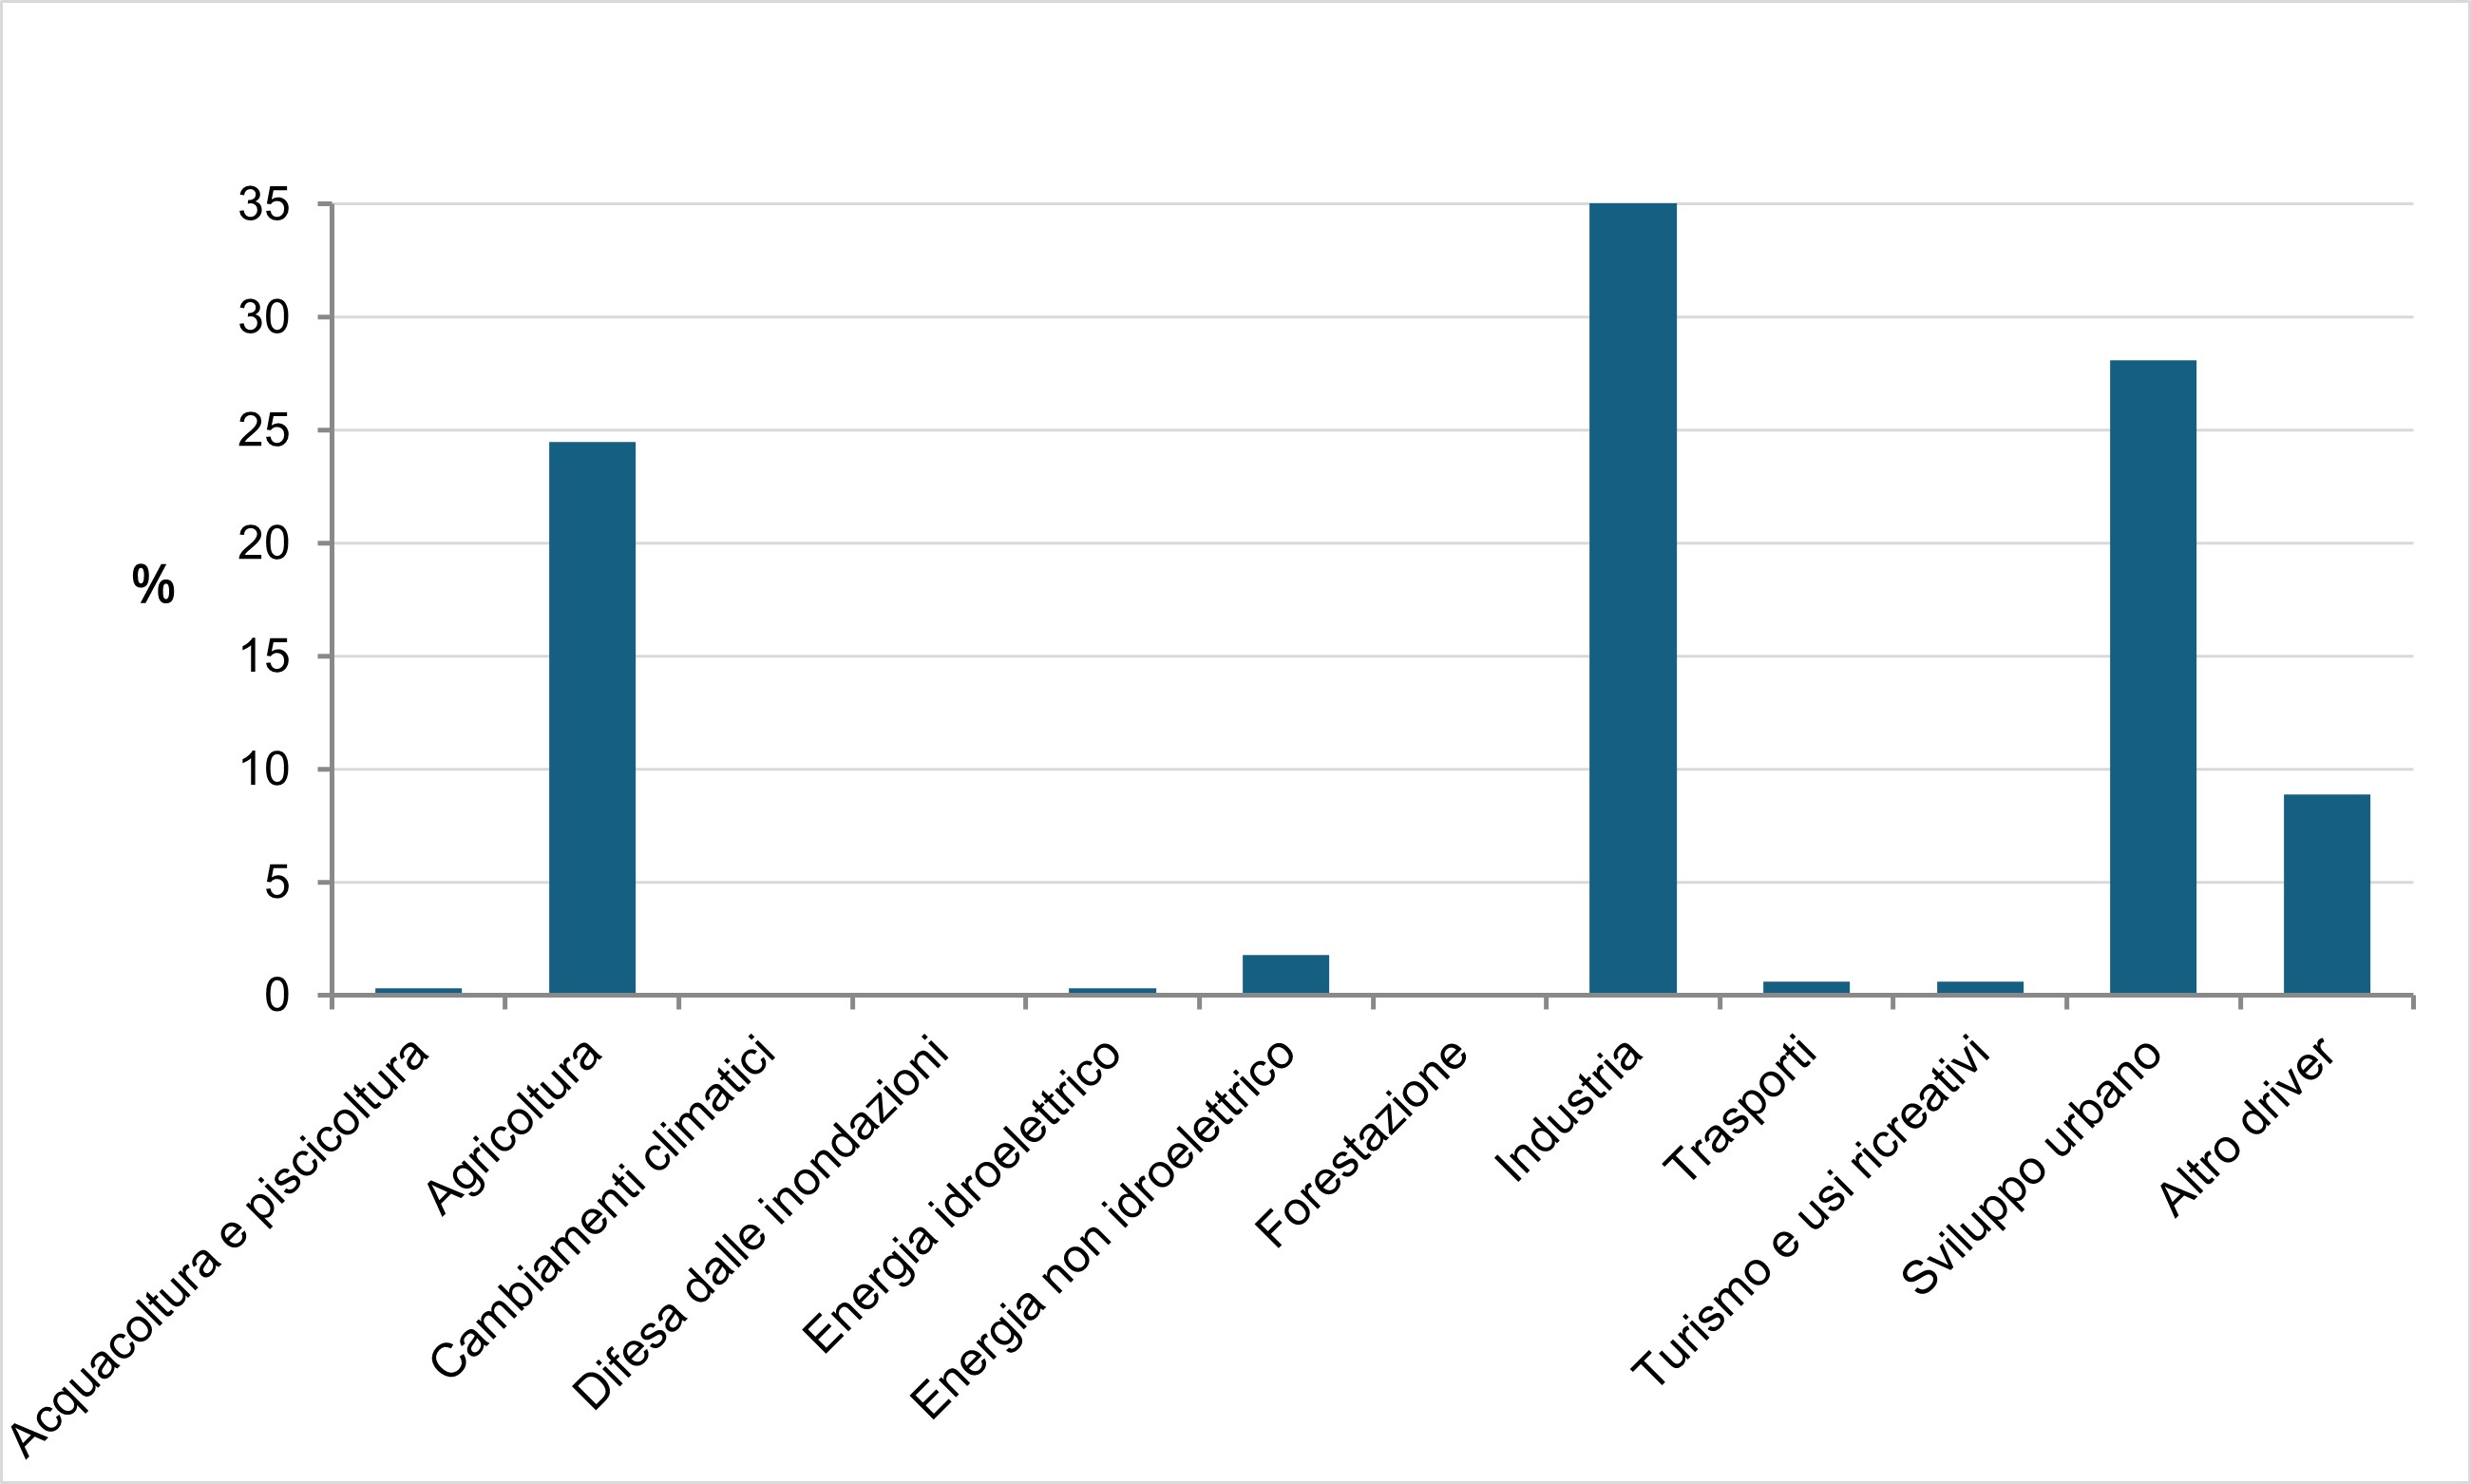
Figure 4b: Groundwater bodies - Impact of socio-economic and environmental drivers of significant pressures Data source
ISPRA processing on WISE 2022 reporting data |
Thumbnail
Headline
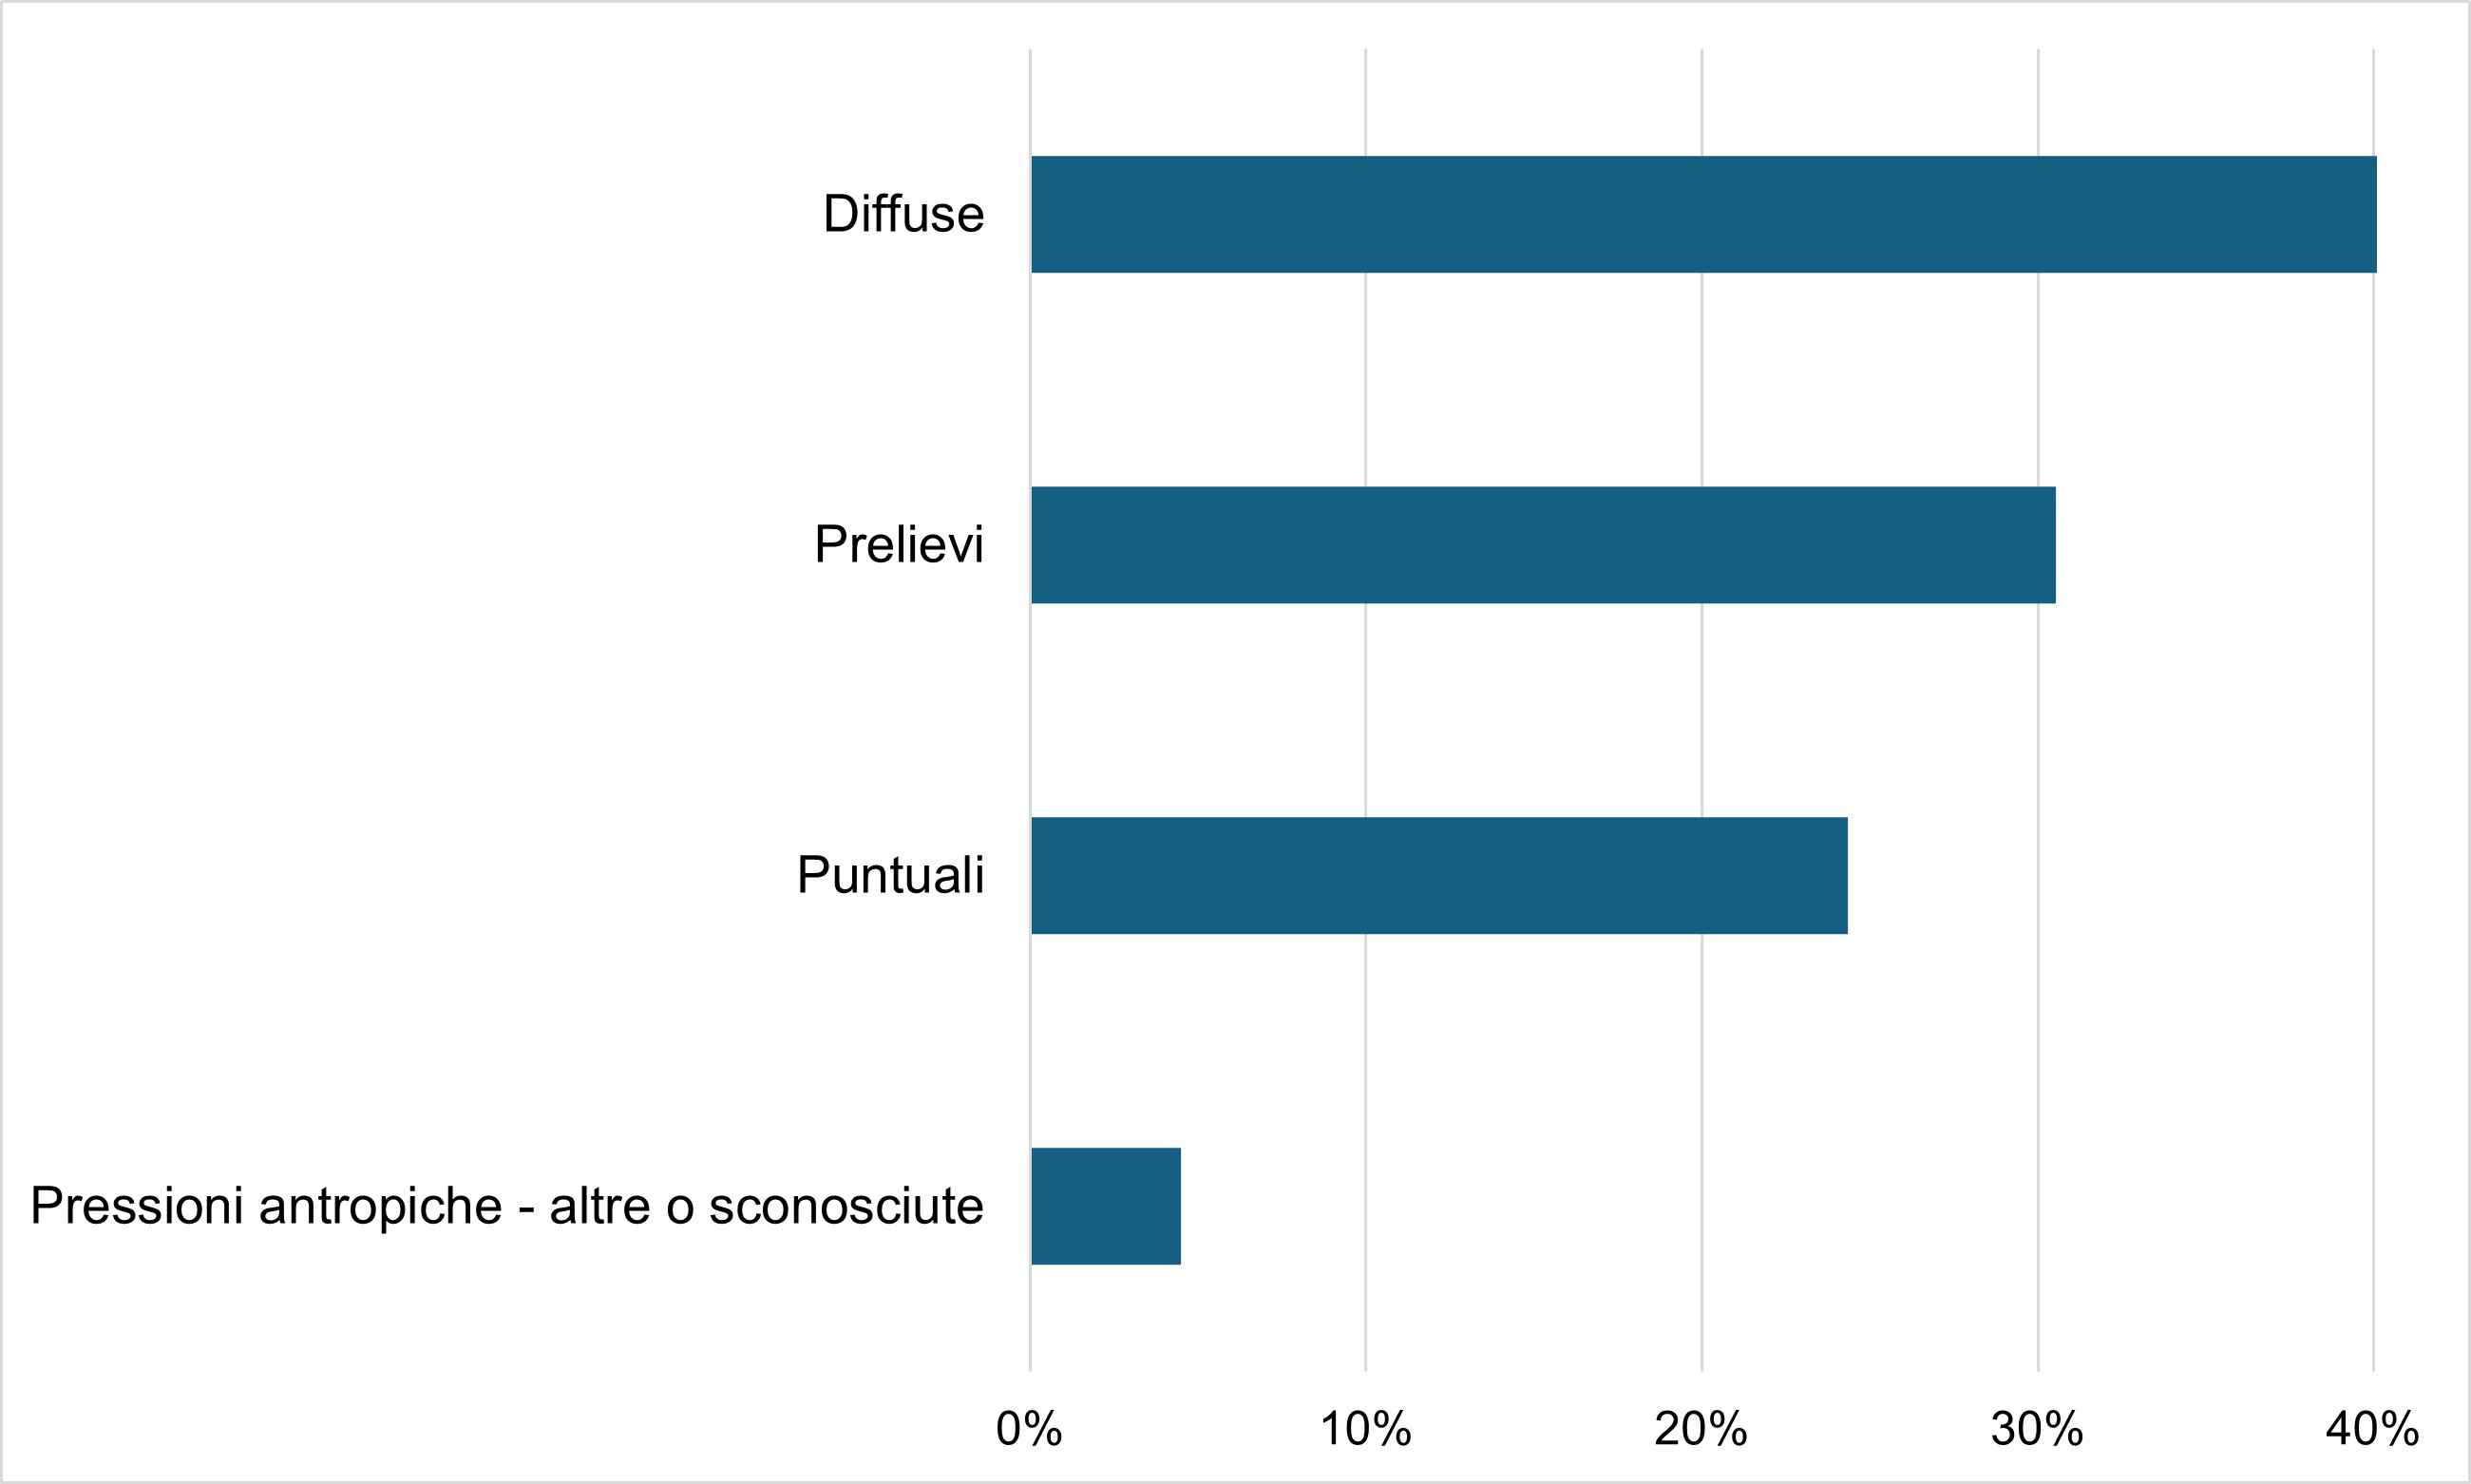
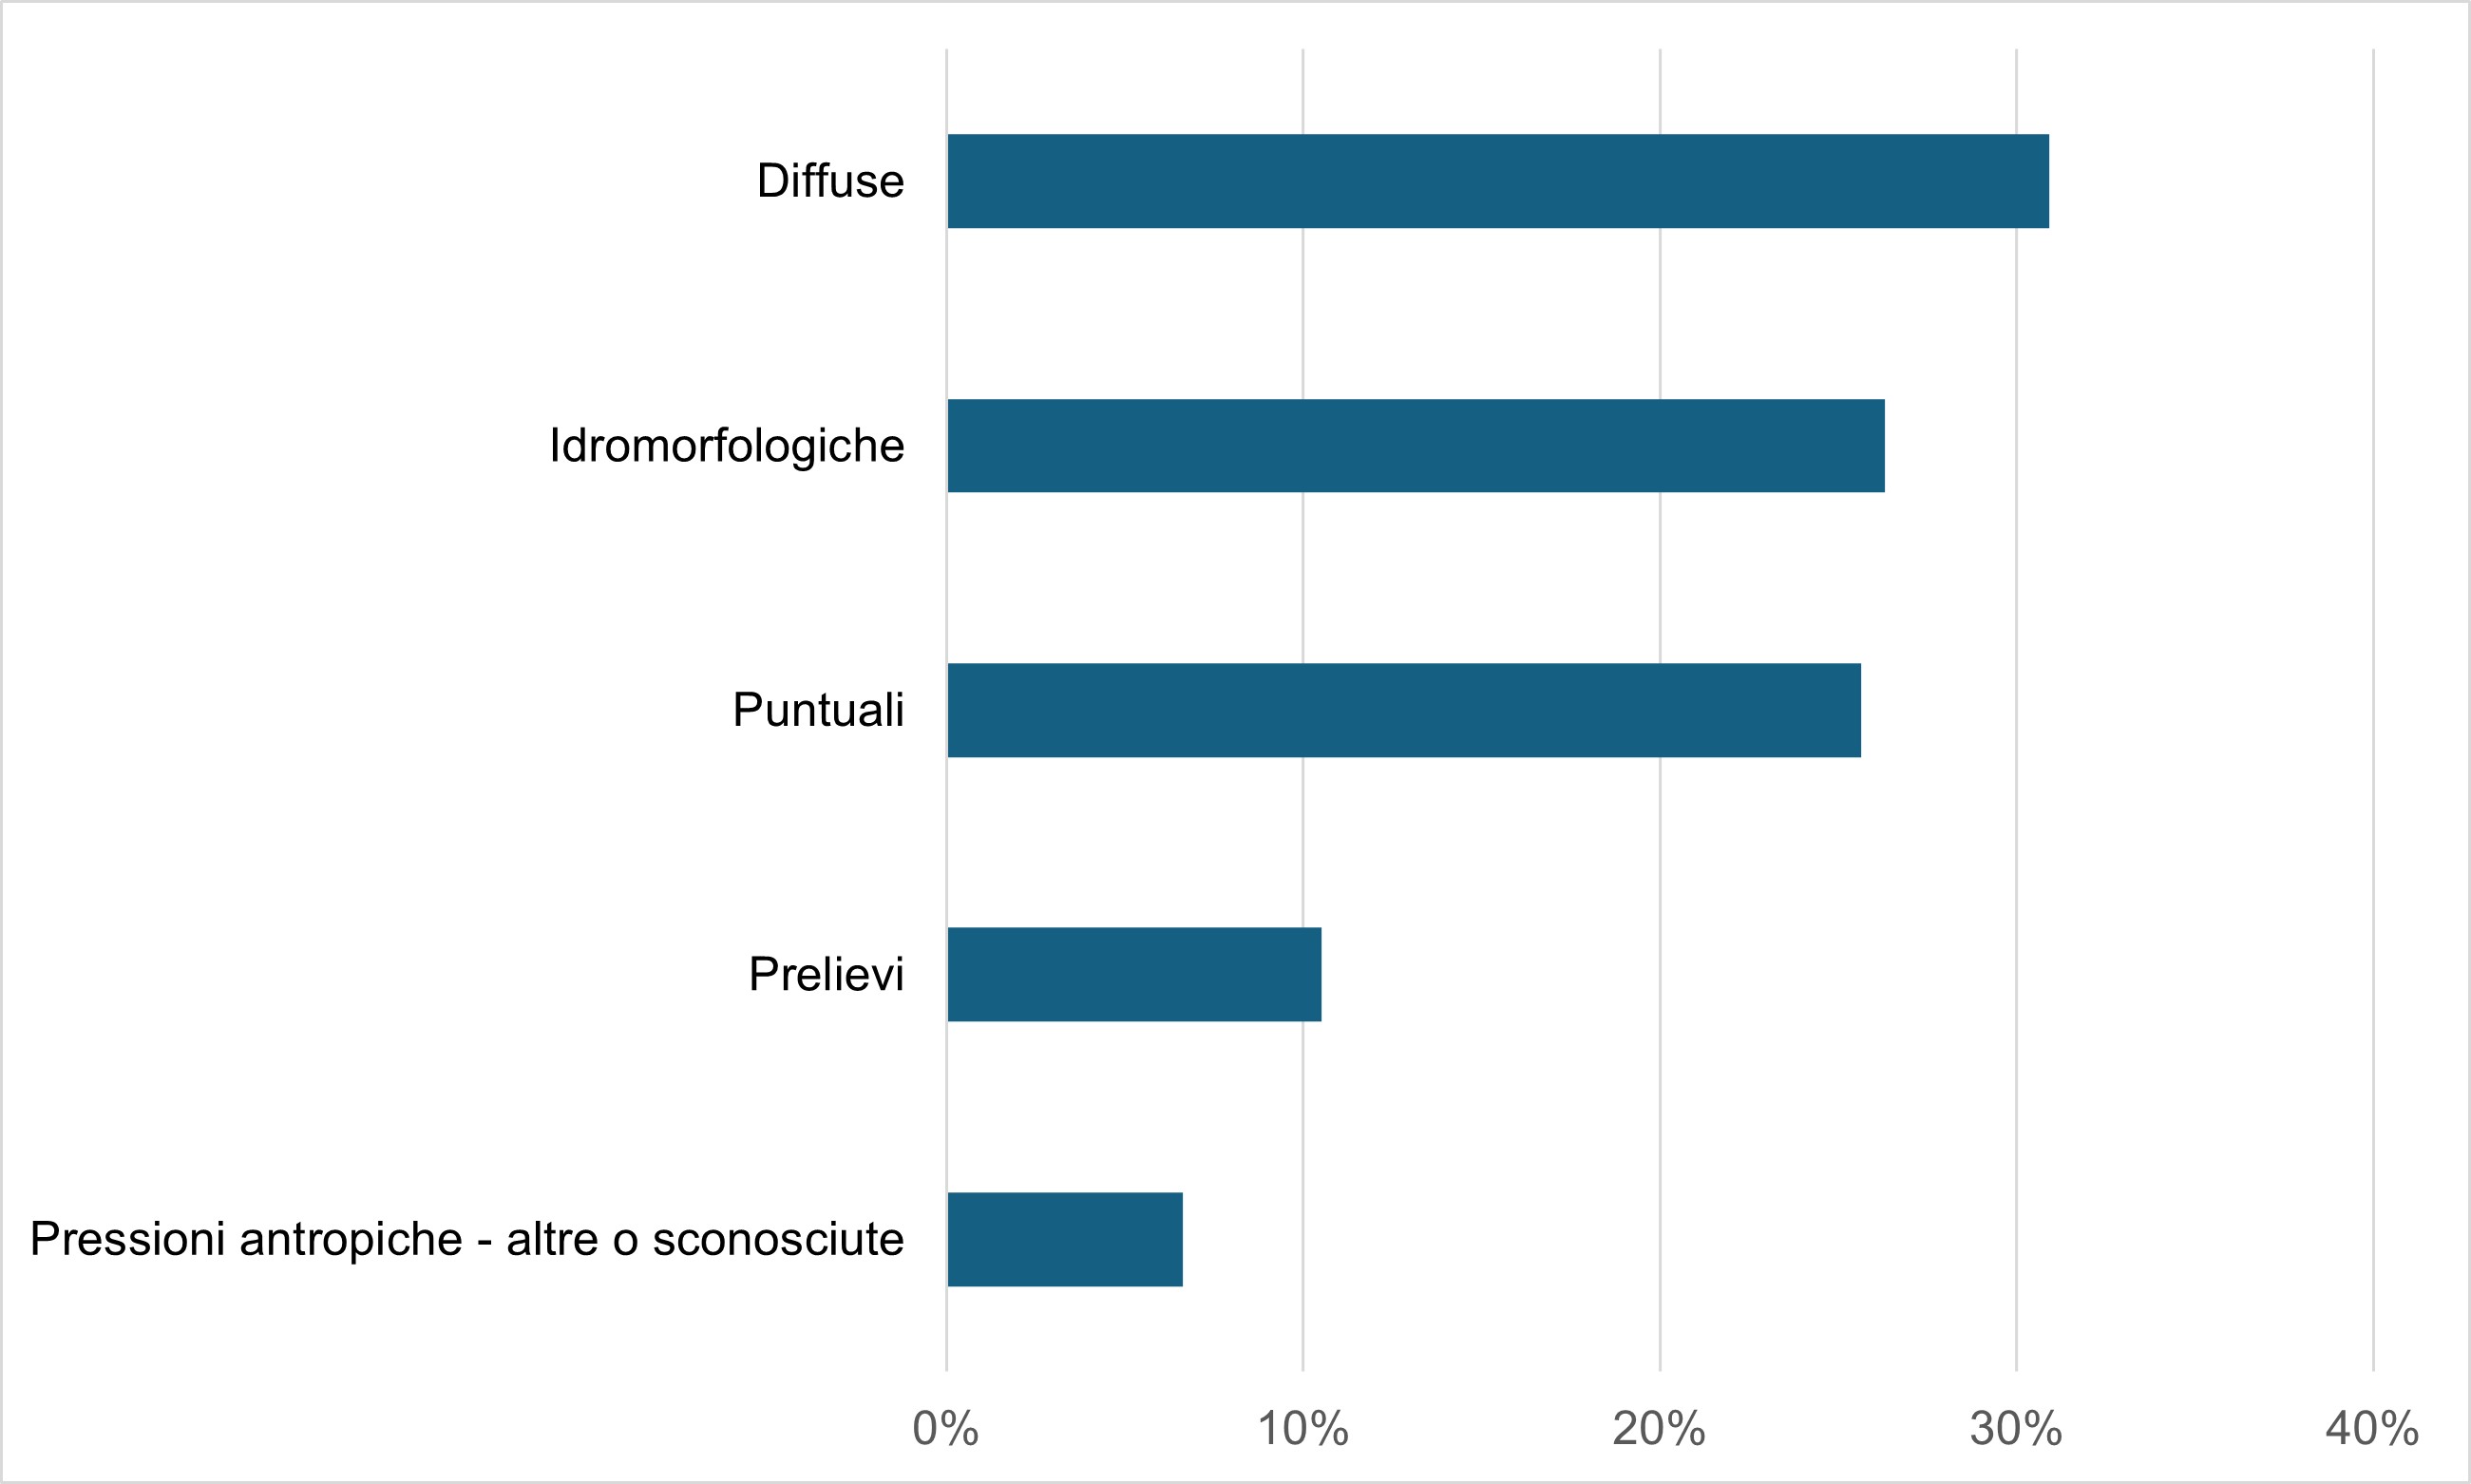
Figure 1b: Groundwater bodies – prevalent pressure macrotypes Data source
ISPRA processing on WISE 2022 reporting data |
Thumbnail
Headline
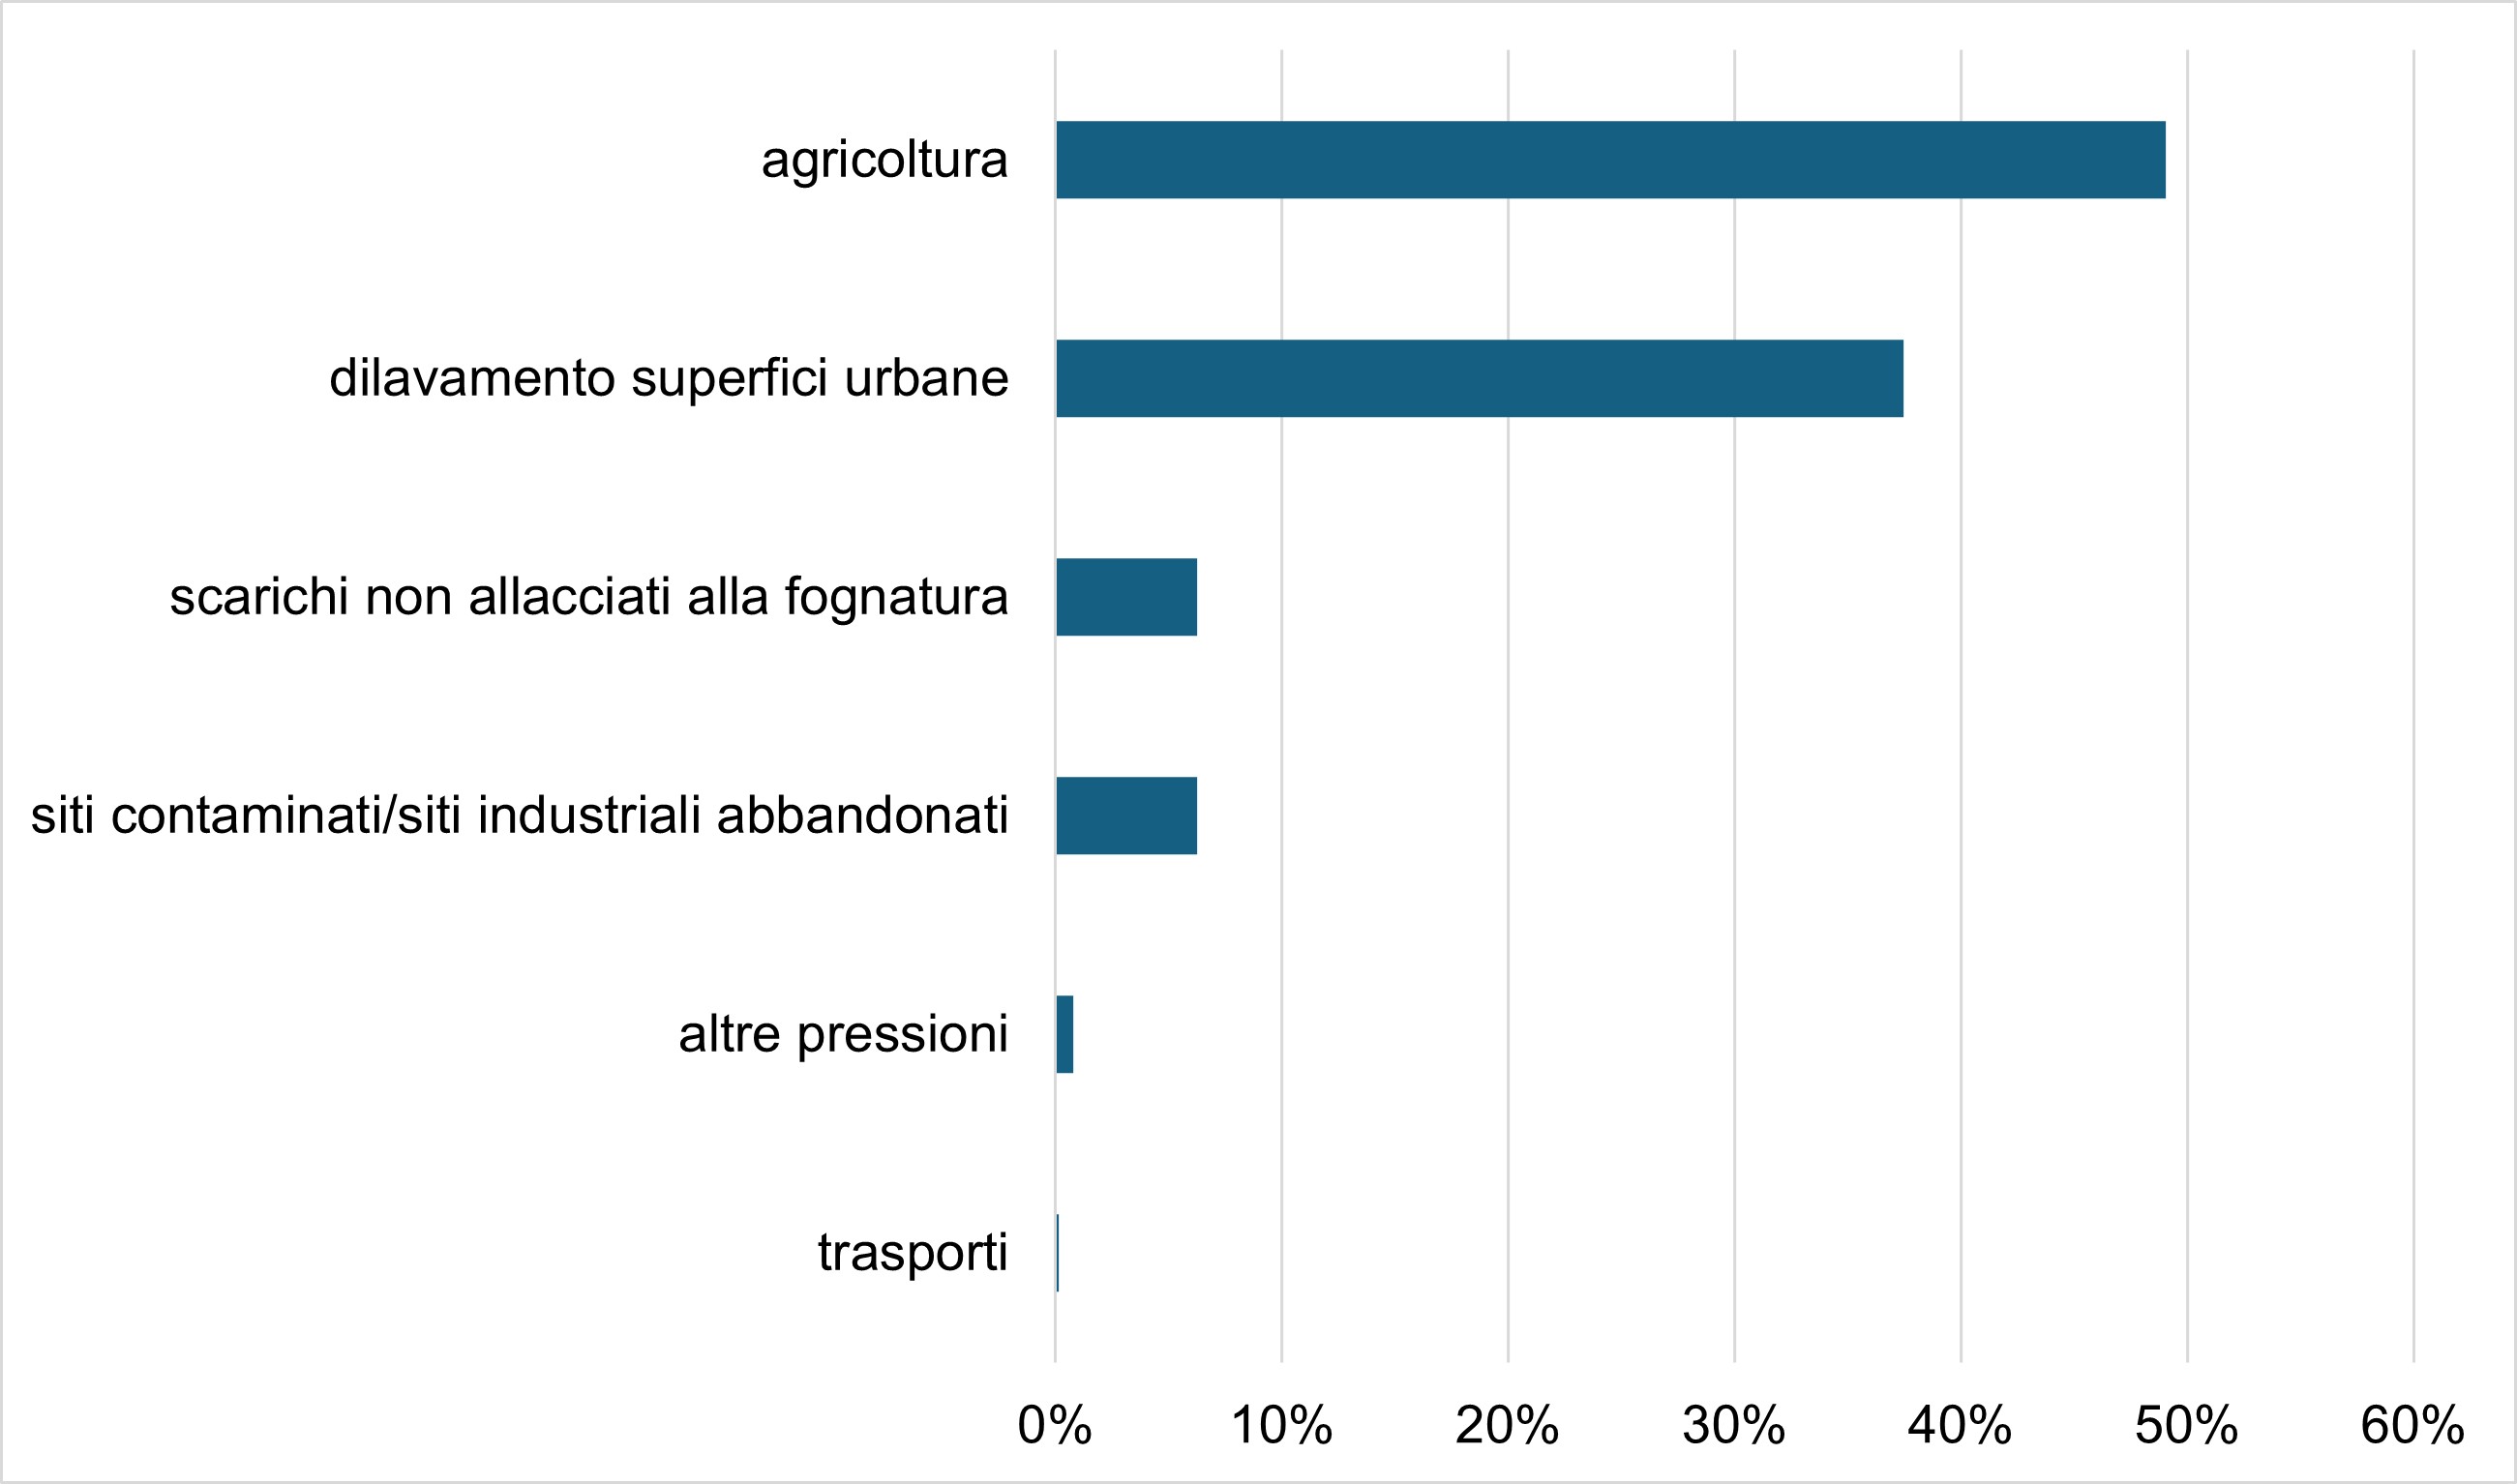
Figure 5b: Diffuse pressures on groundwater bodies - distribution between different uses Data source
ISPRA processing on WISE 2022 reporting data |
Thumbnail
Headline
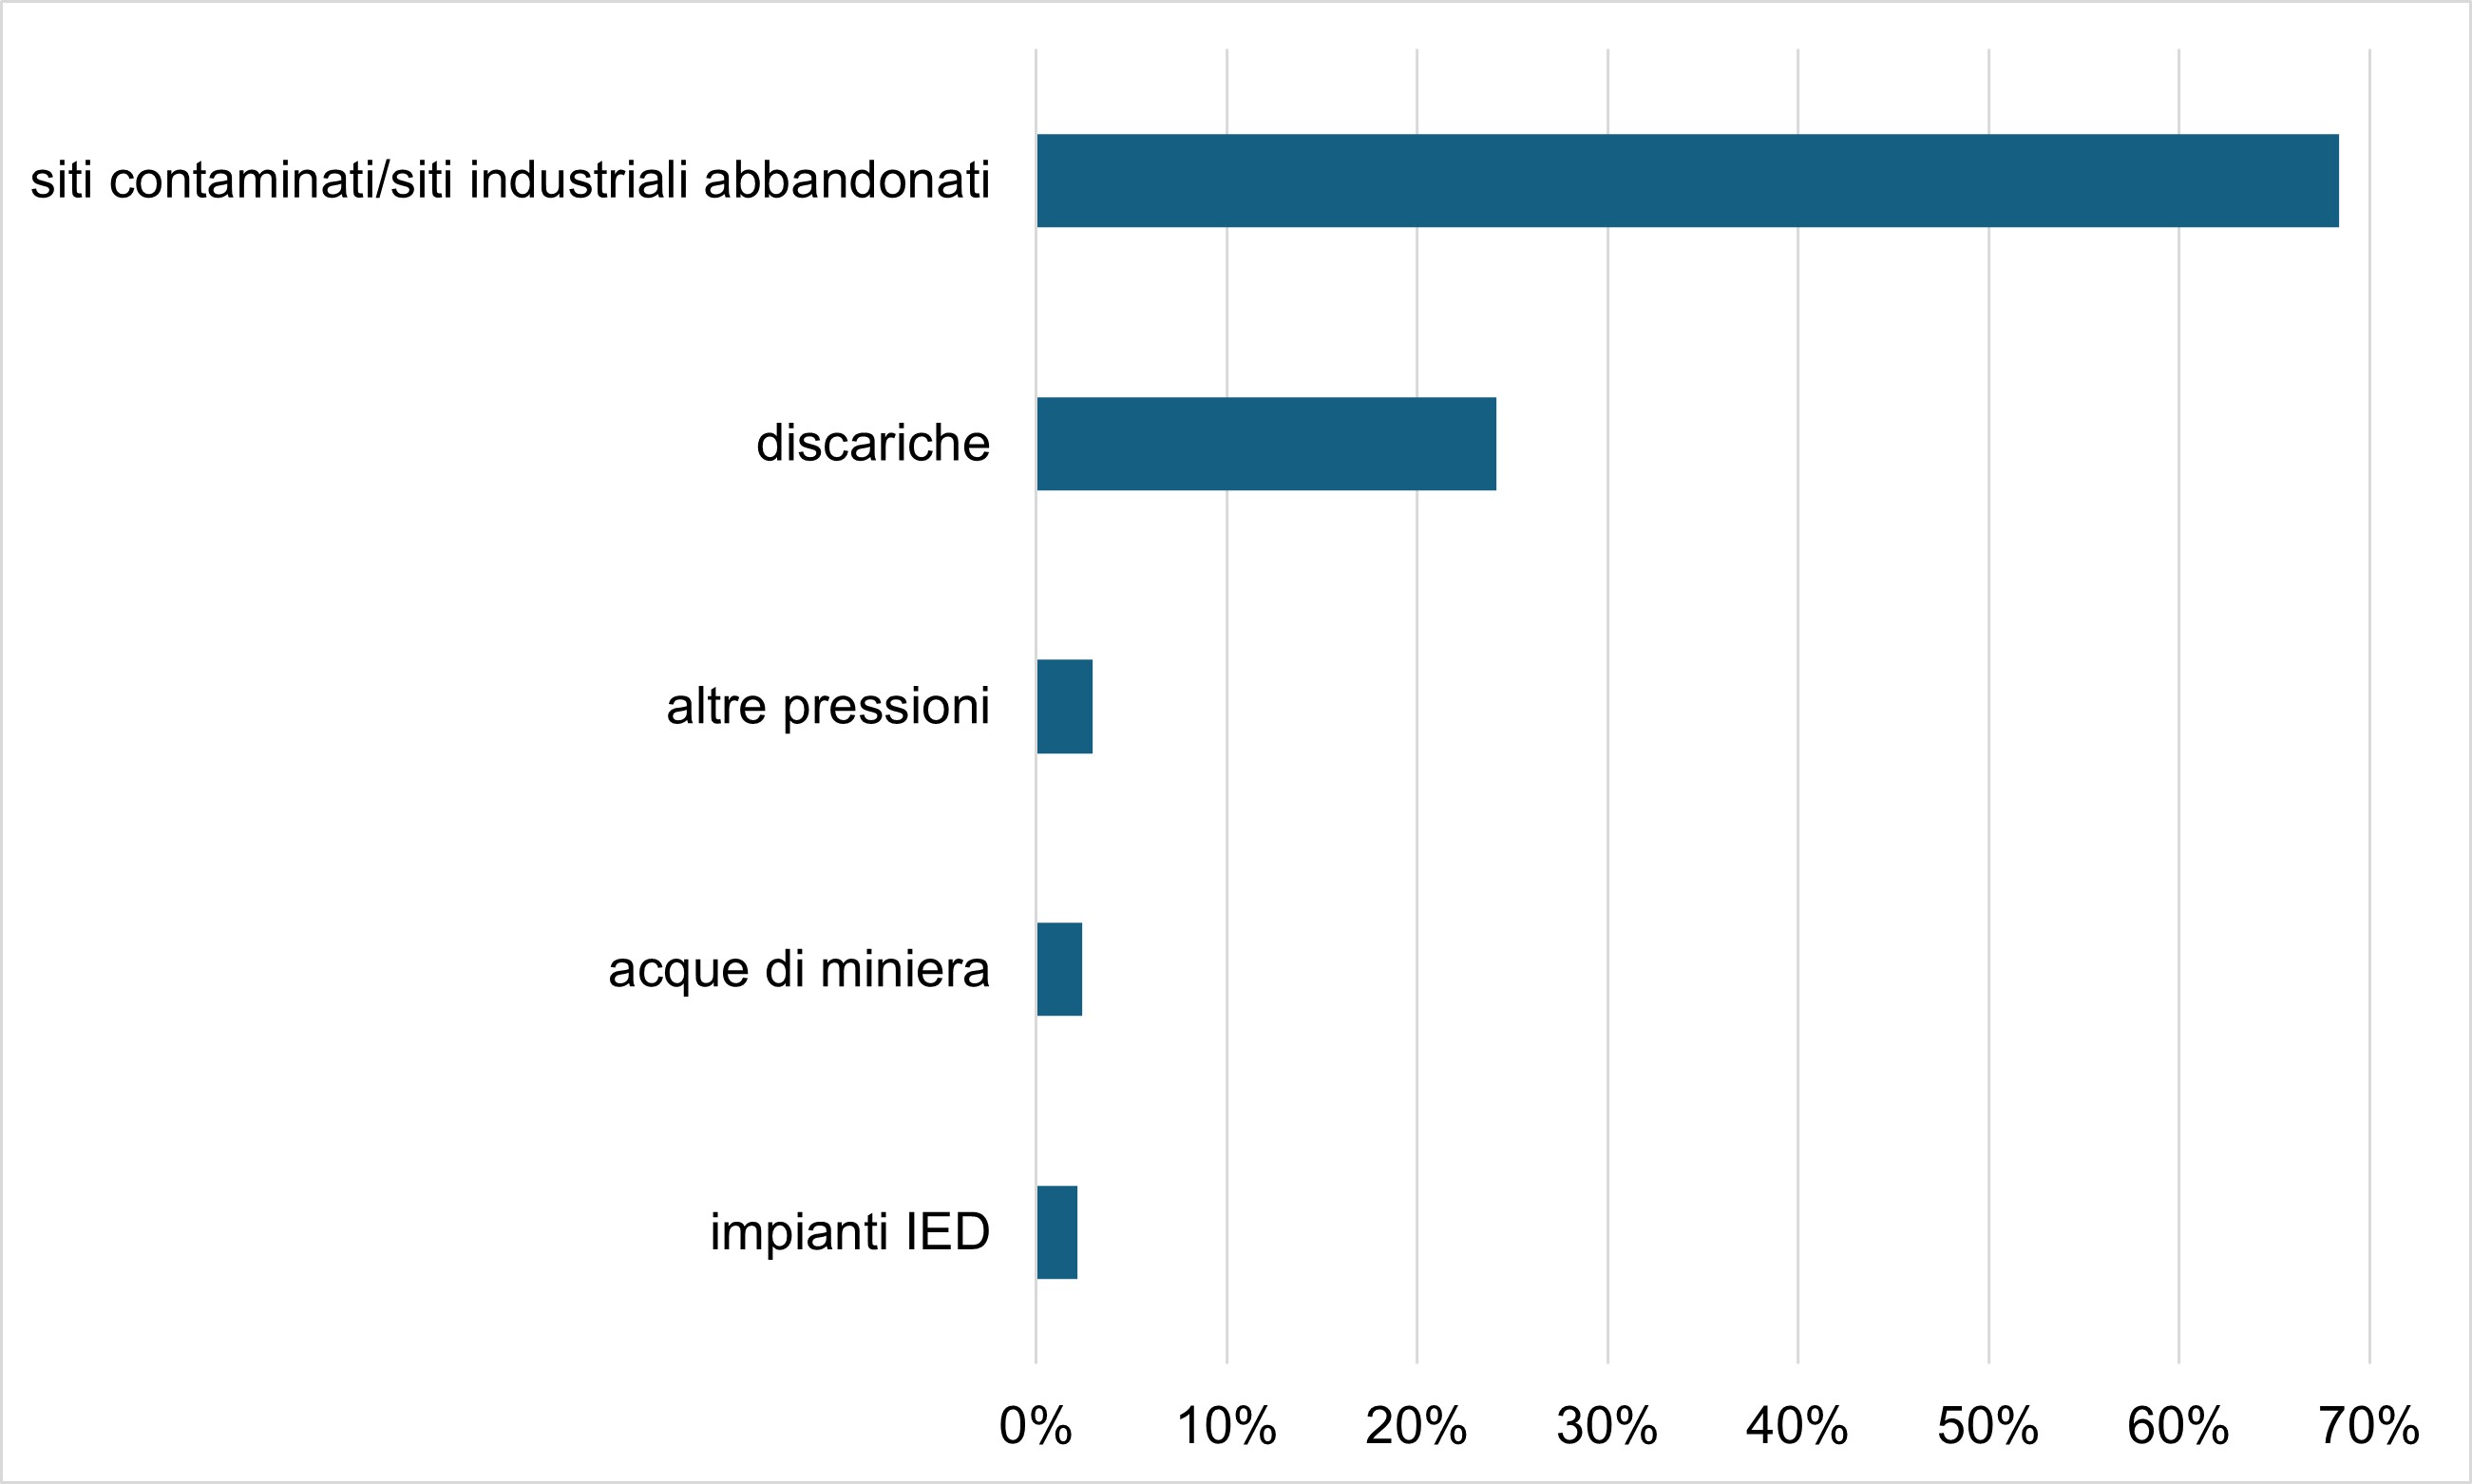
Figure 6b: Punctual pressures on underground water bodies - distribution between different uses Data source
ISPRA processing on WISE 2022 reporting data |
Thumbnail
Headline
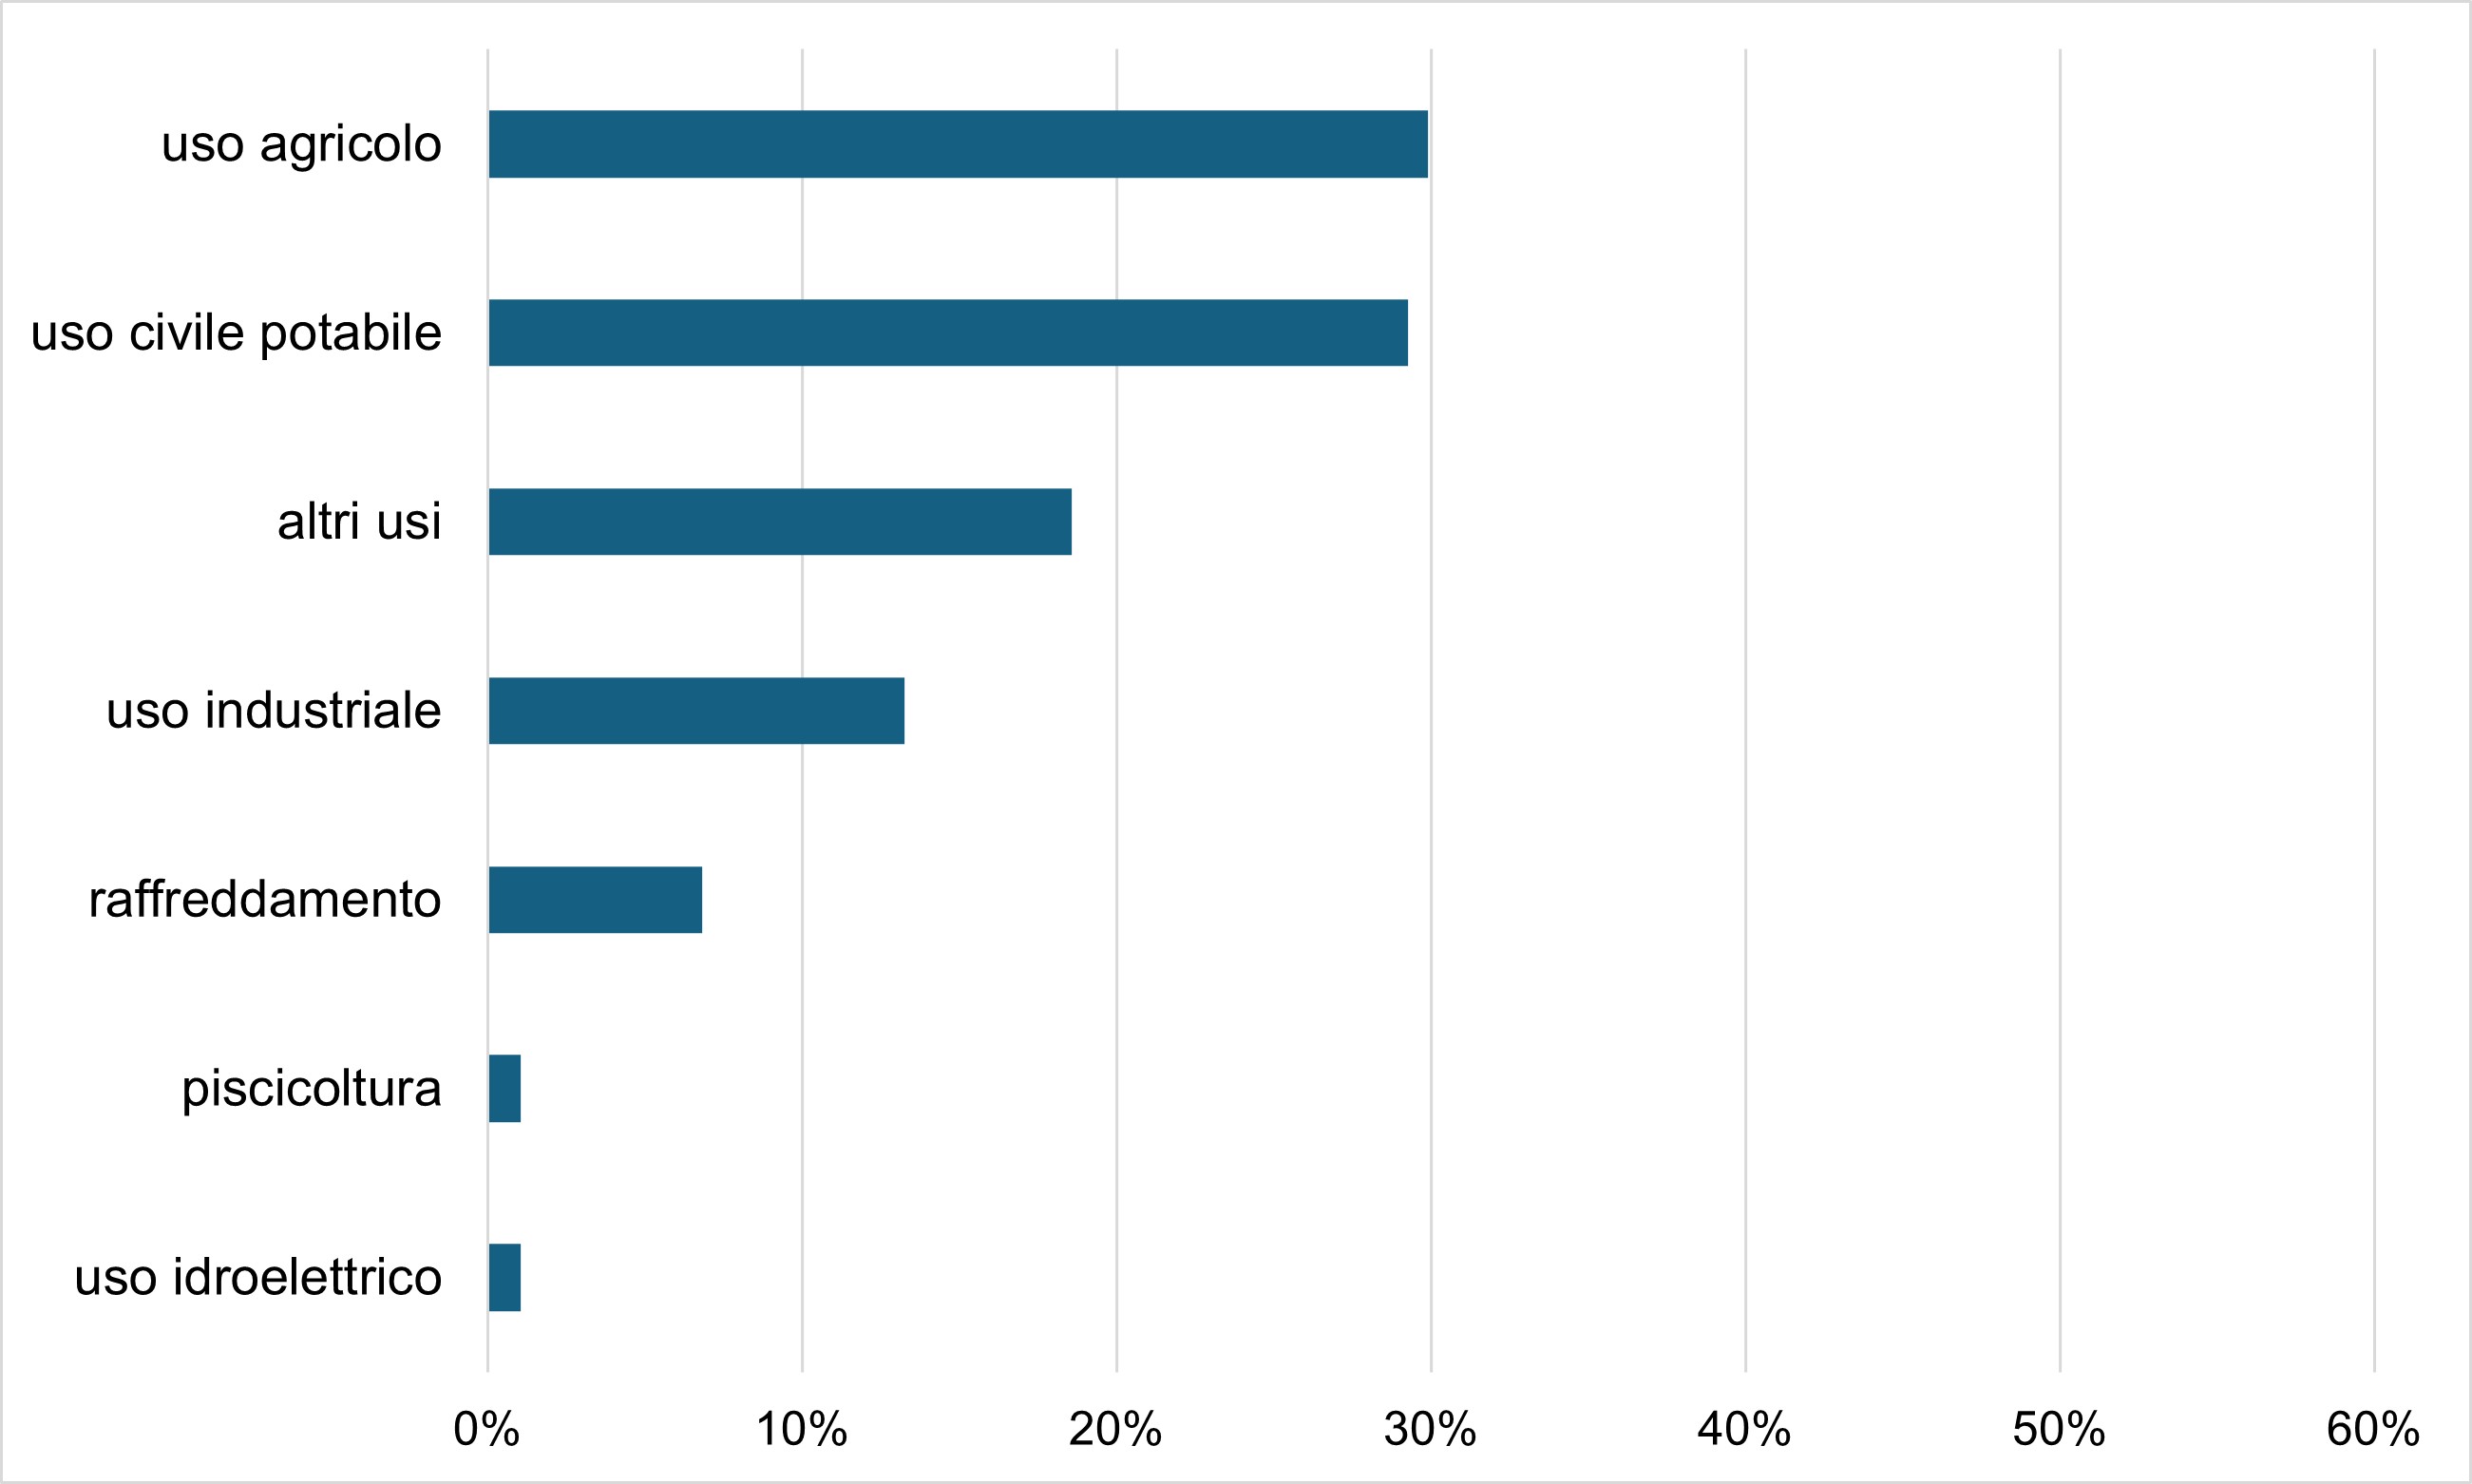
Figure 7b: Pressure of withdrawals from underground water bodies - distribution between different uses Data source
ISPRA processing on WISE 2022 reporting data |
Thumbnail
Headline
Figure 1a: Surface water bodies – prevailing pressure macrotypes Data source
ISPRA processing on WISE 2022 reporting data |
Thumbnail
Headline
Figure 2a: Surface water bodies - Distribution of significant prevailing pressures by district Data source
ISPRA processing on WISE 2022 reporting data Note
Only surface water bodies impacted by a single type of pressure were taken into consideration |
Thumbnail
Headline
Figure 3: Surface water bodies – distribution of prevailing pressure macrotypes by water body category Data source
ISPRA processing on WISE 2022 reporting data Note
Water bodies can be impacted by multiple macrotypes of pressure |
Thumbnail
Headline
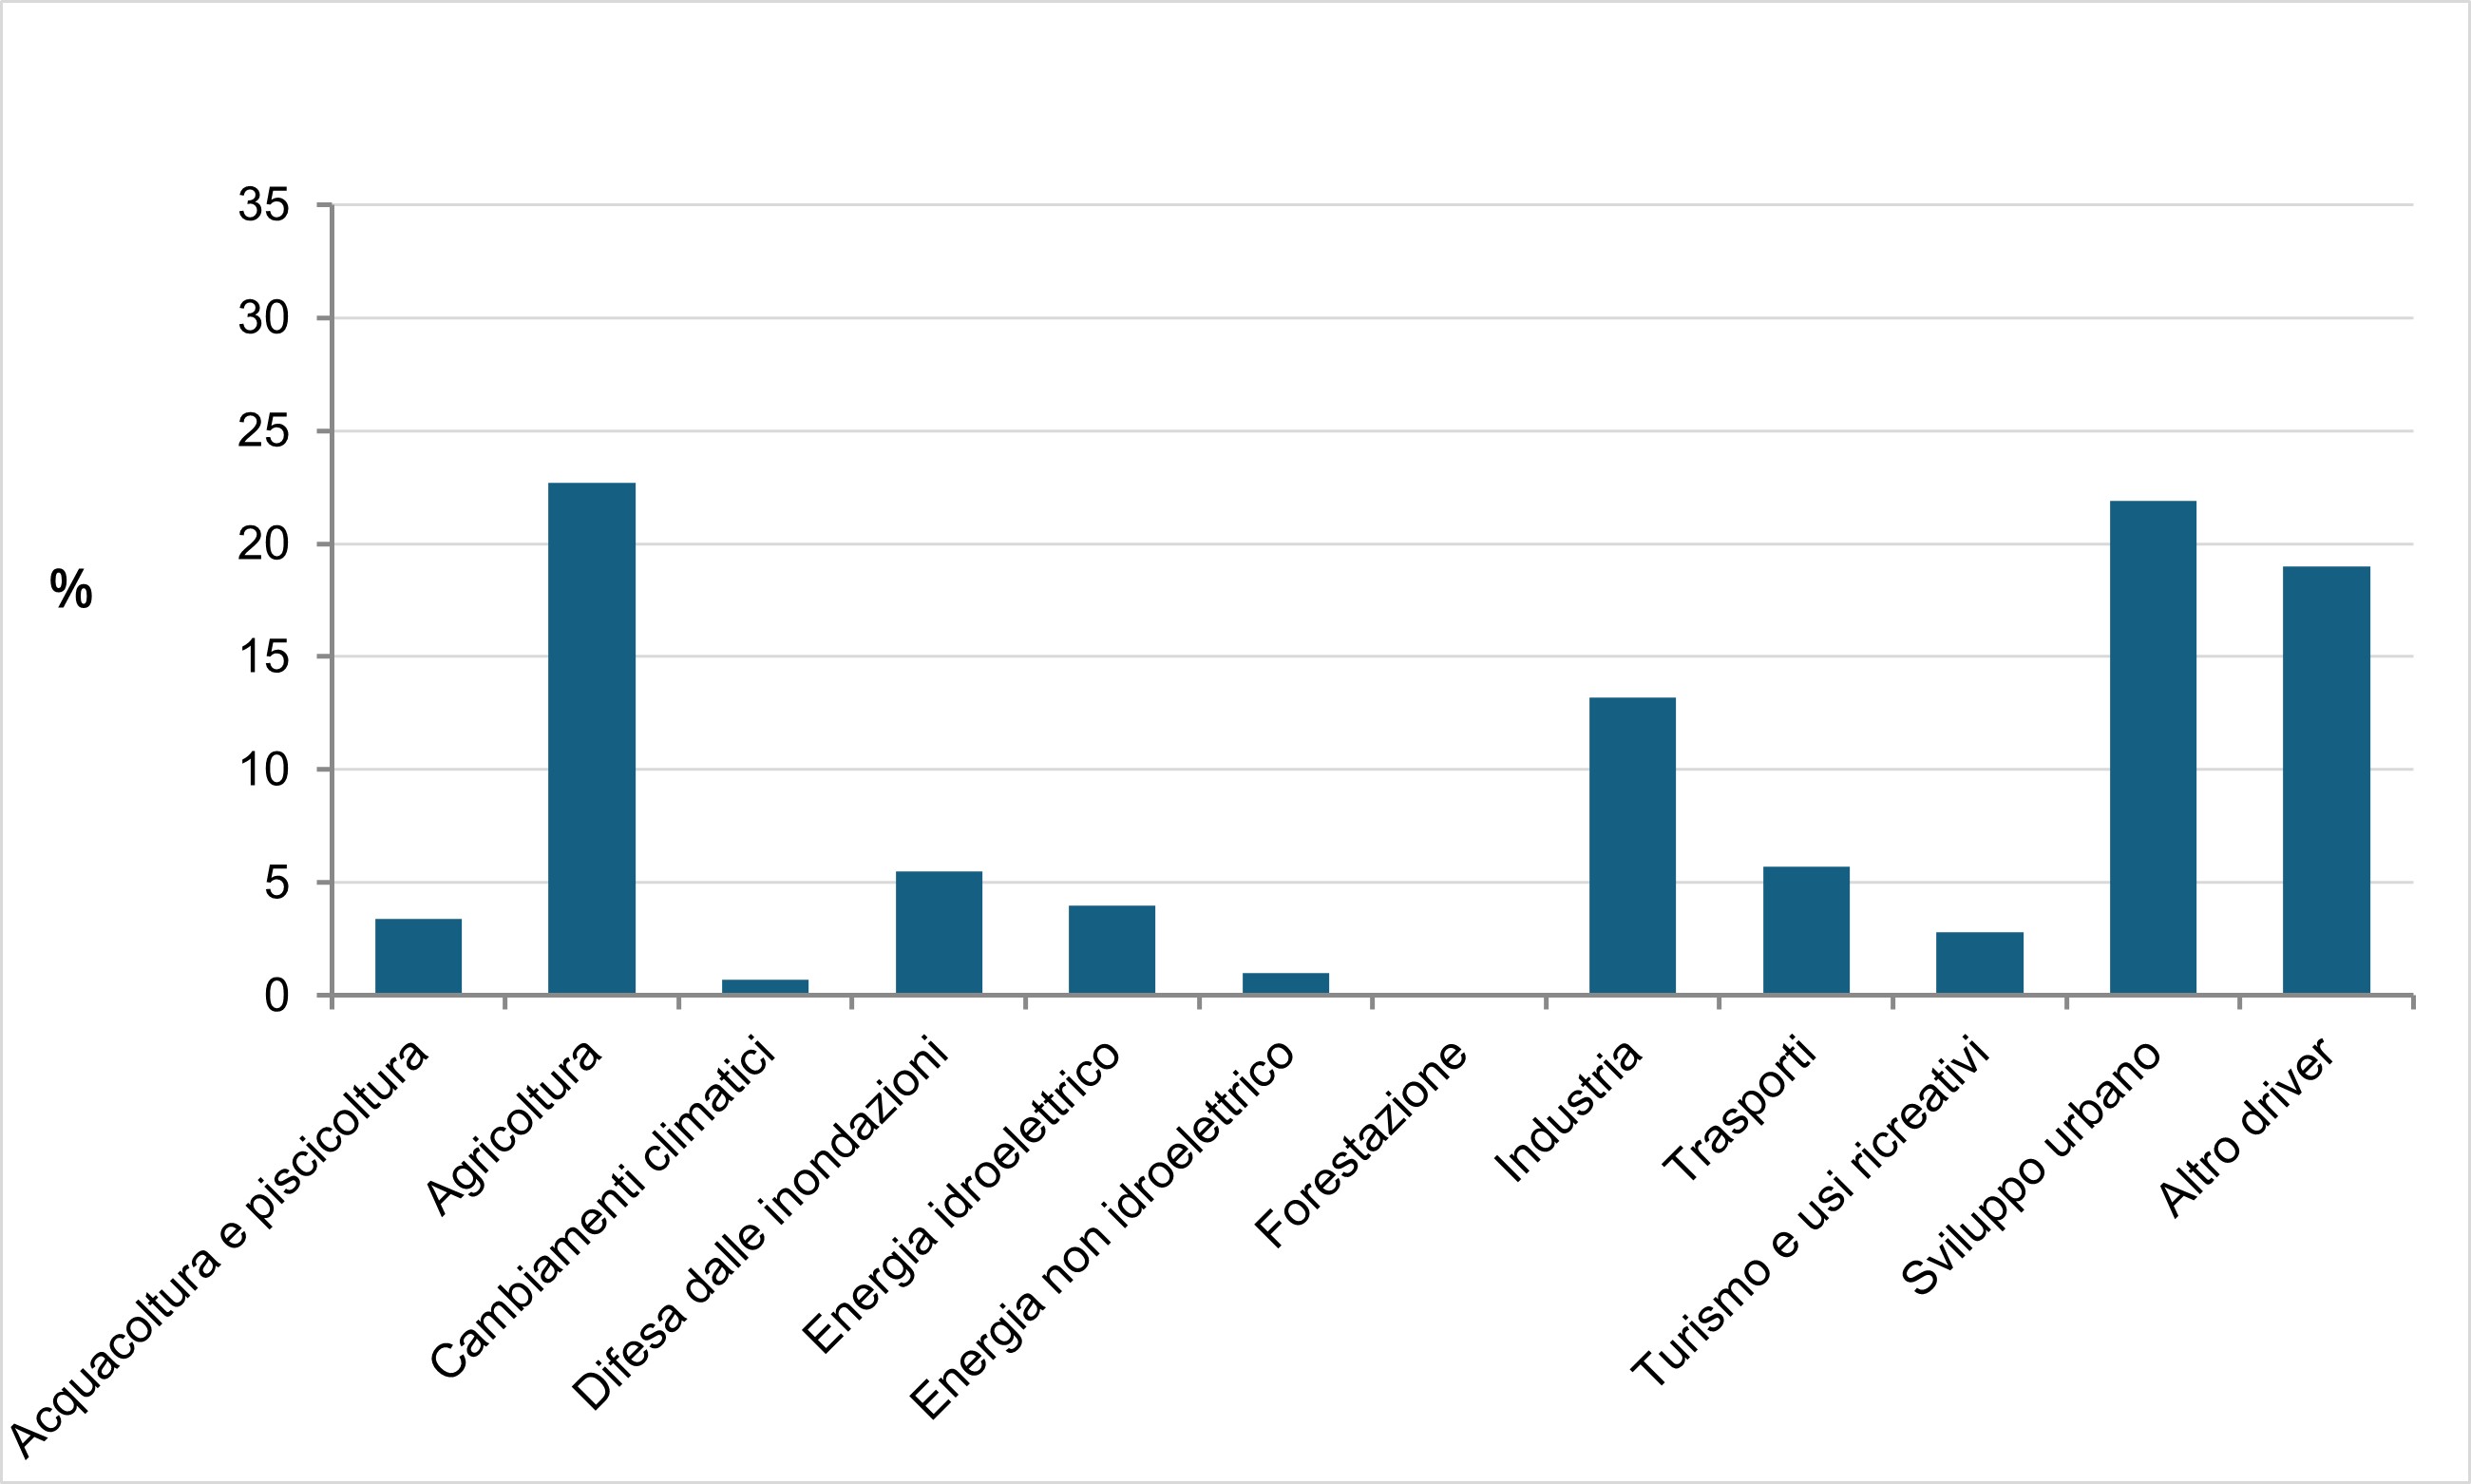
Figure 4a: Surface water bodies - Incidence of socio-economic and environmental determinants of significant pressures Data source
ISPRA processing on WISE 2022 reporting data |
Thumbnail
Headline
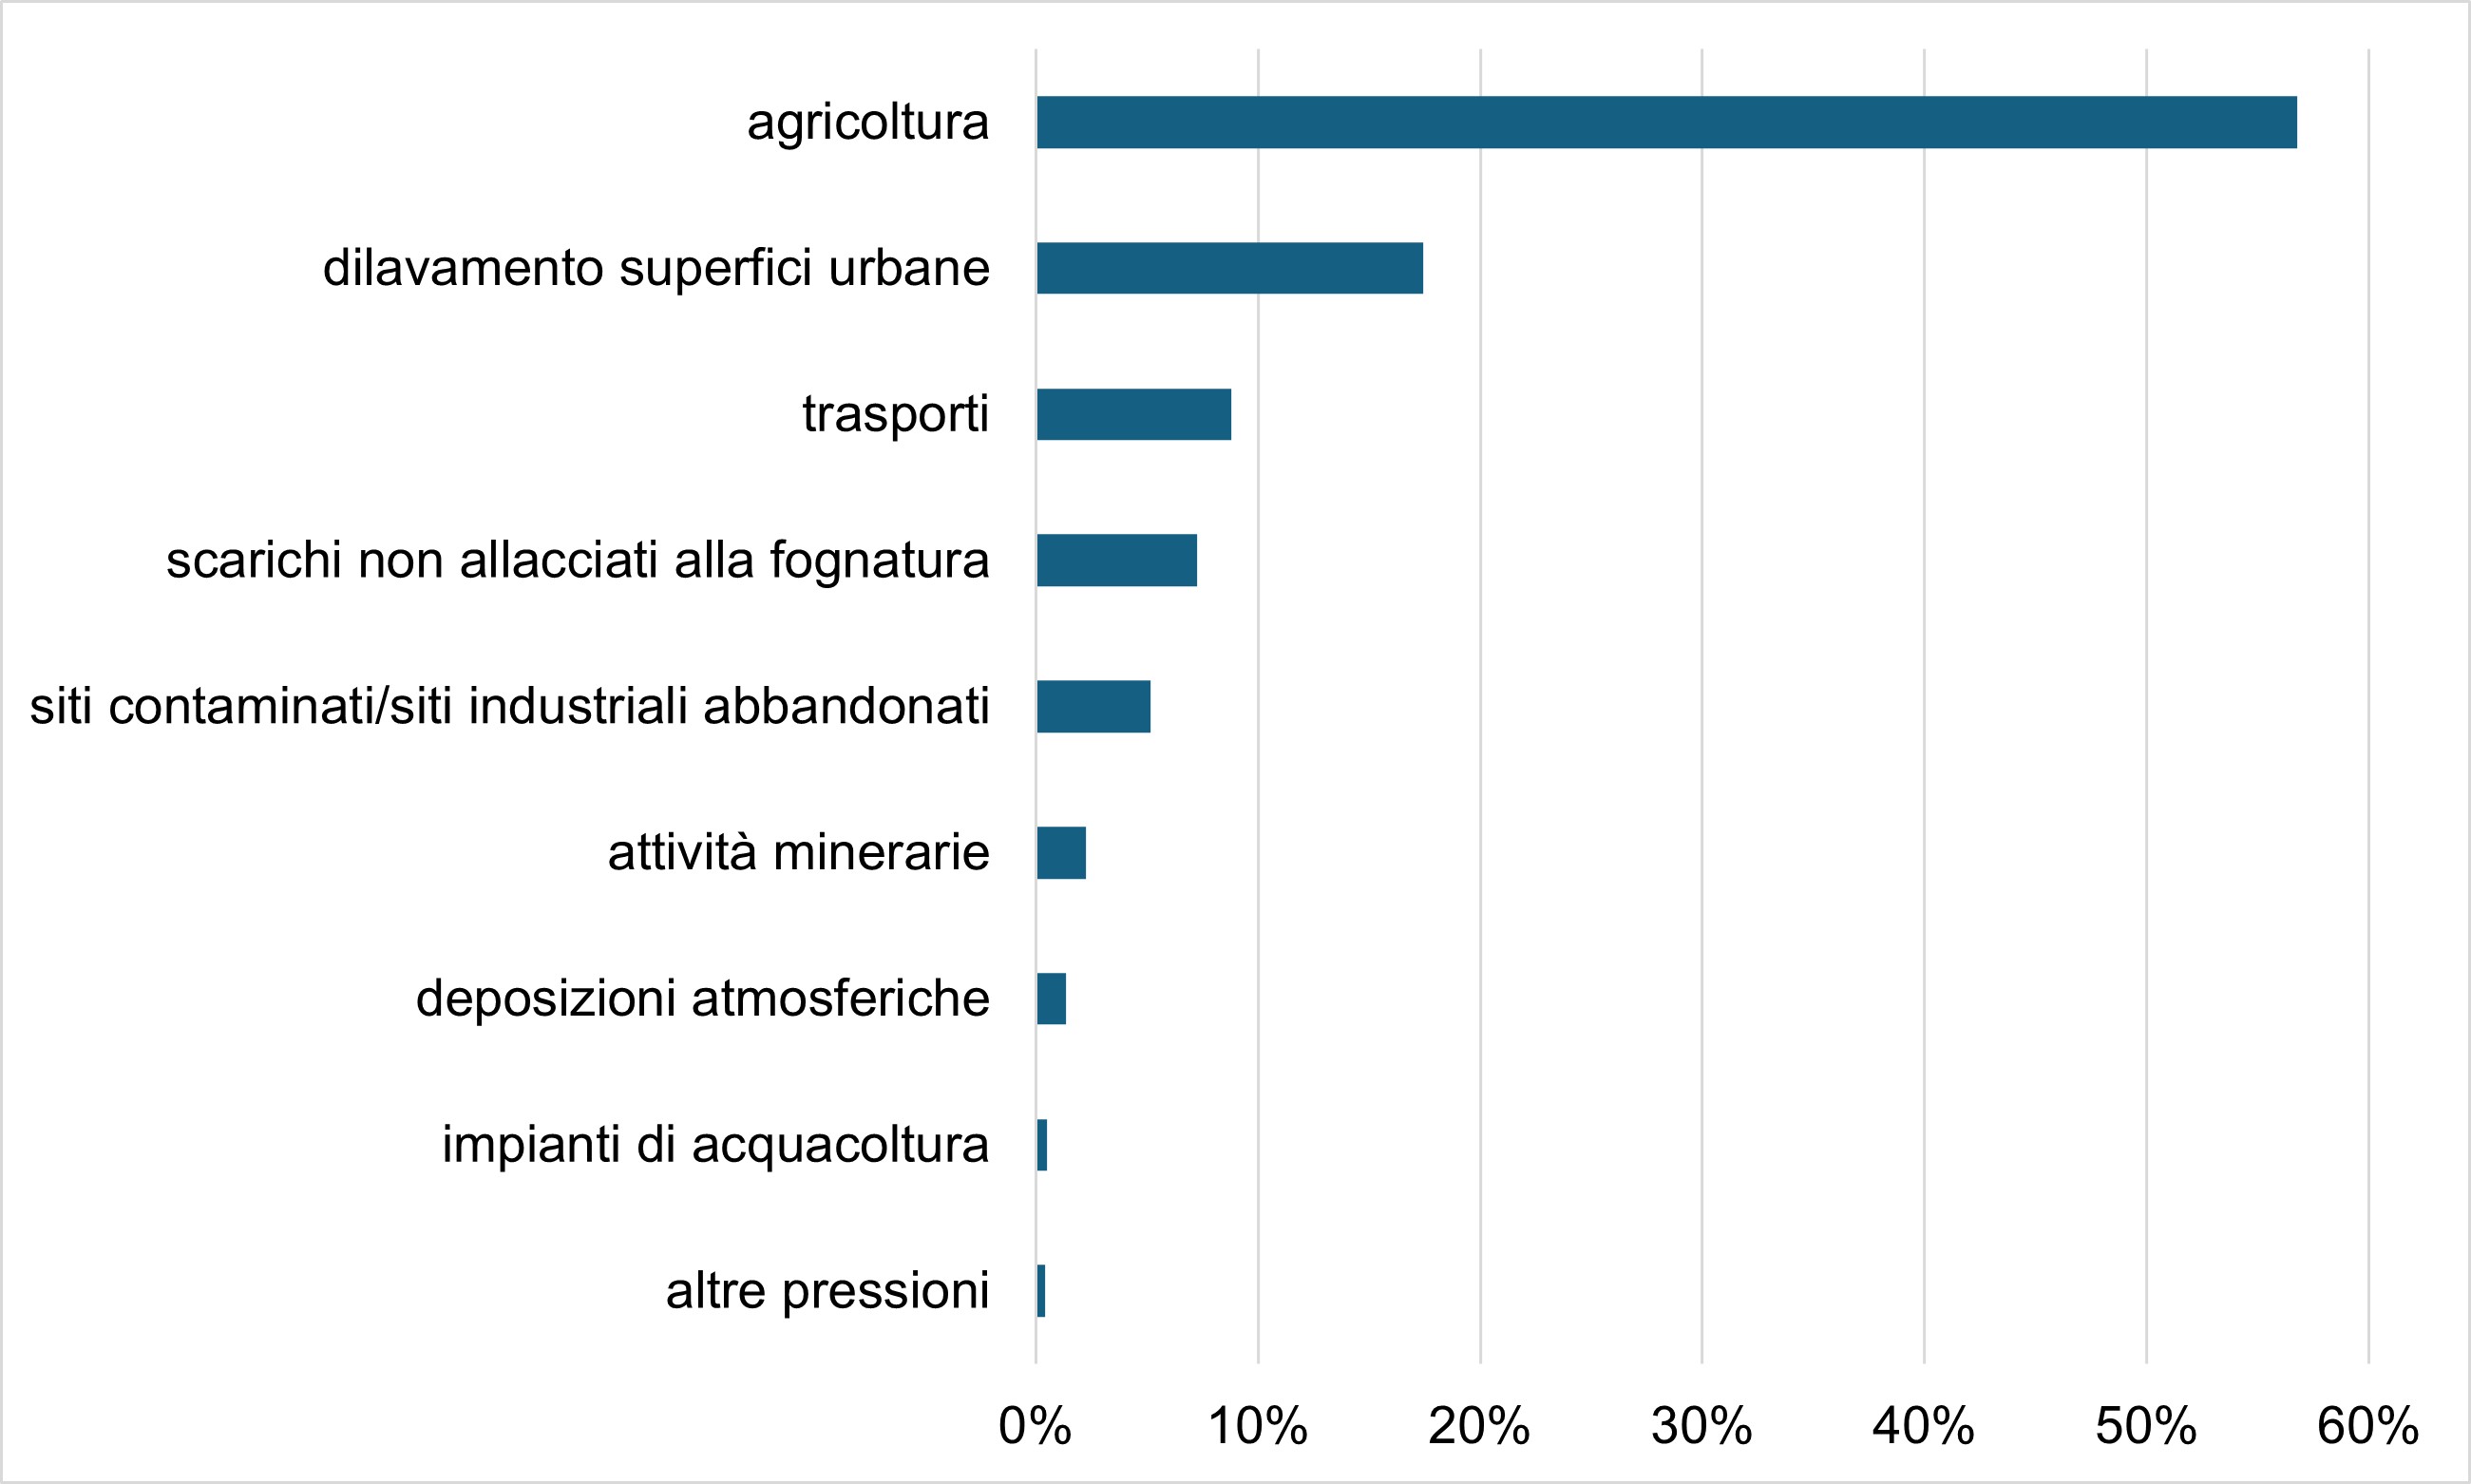
Figure 5a: Diffuse pressures on surface water bodies - distribution between different uses Data source
ISPRA processing on WISE 2022 reporting data |
Thumbnail
Headline
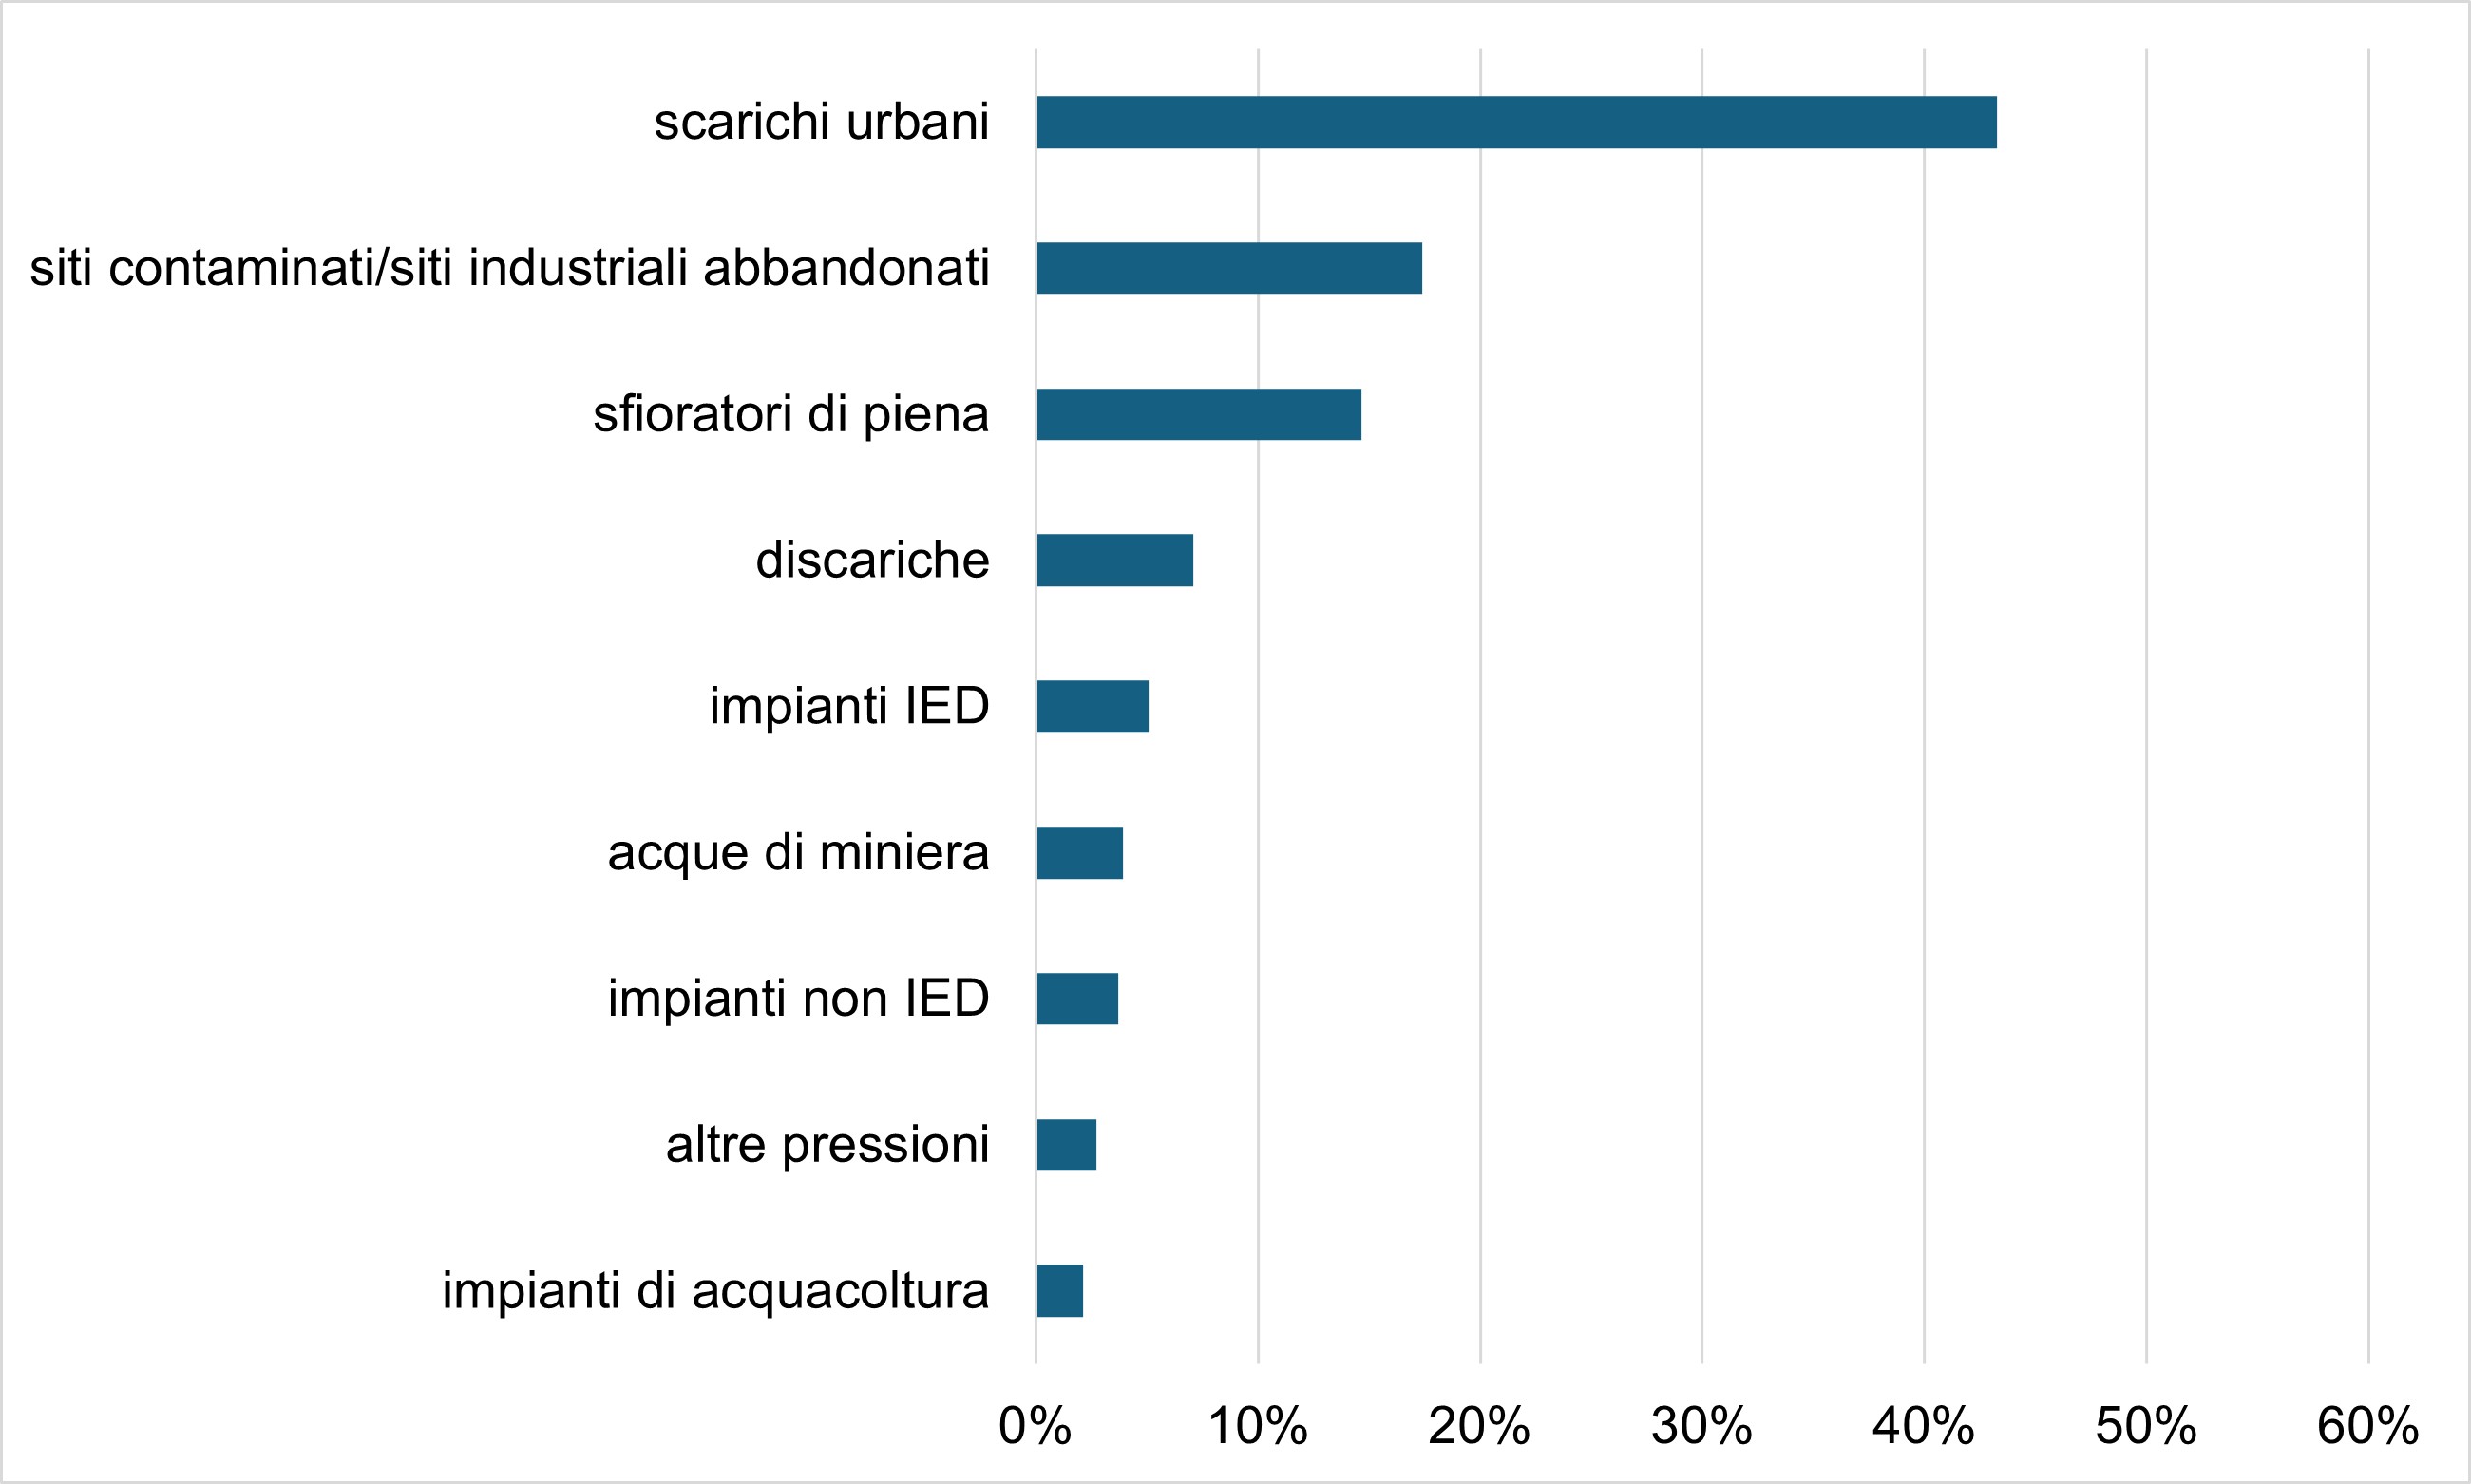
Figure 6a: Punctual pressures on surface water bodies - distribution between different uses Data source
ISPRA processing on WISE 2022 reporting data |
Thumbnail
Headline
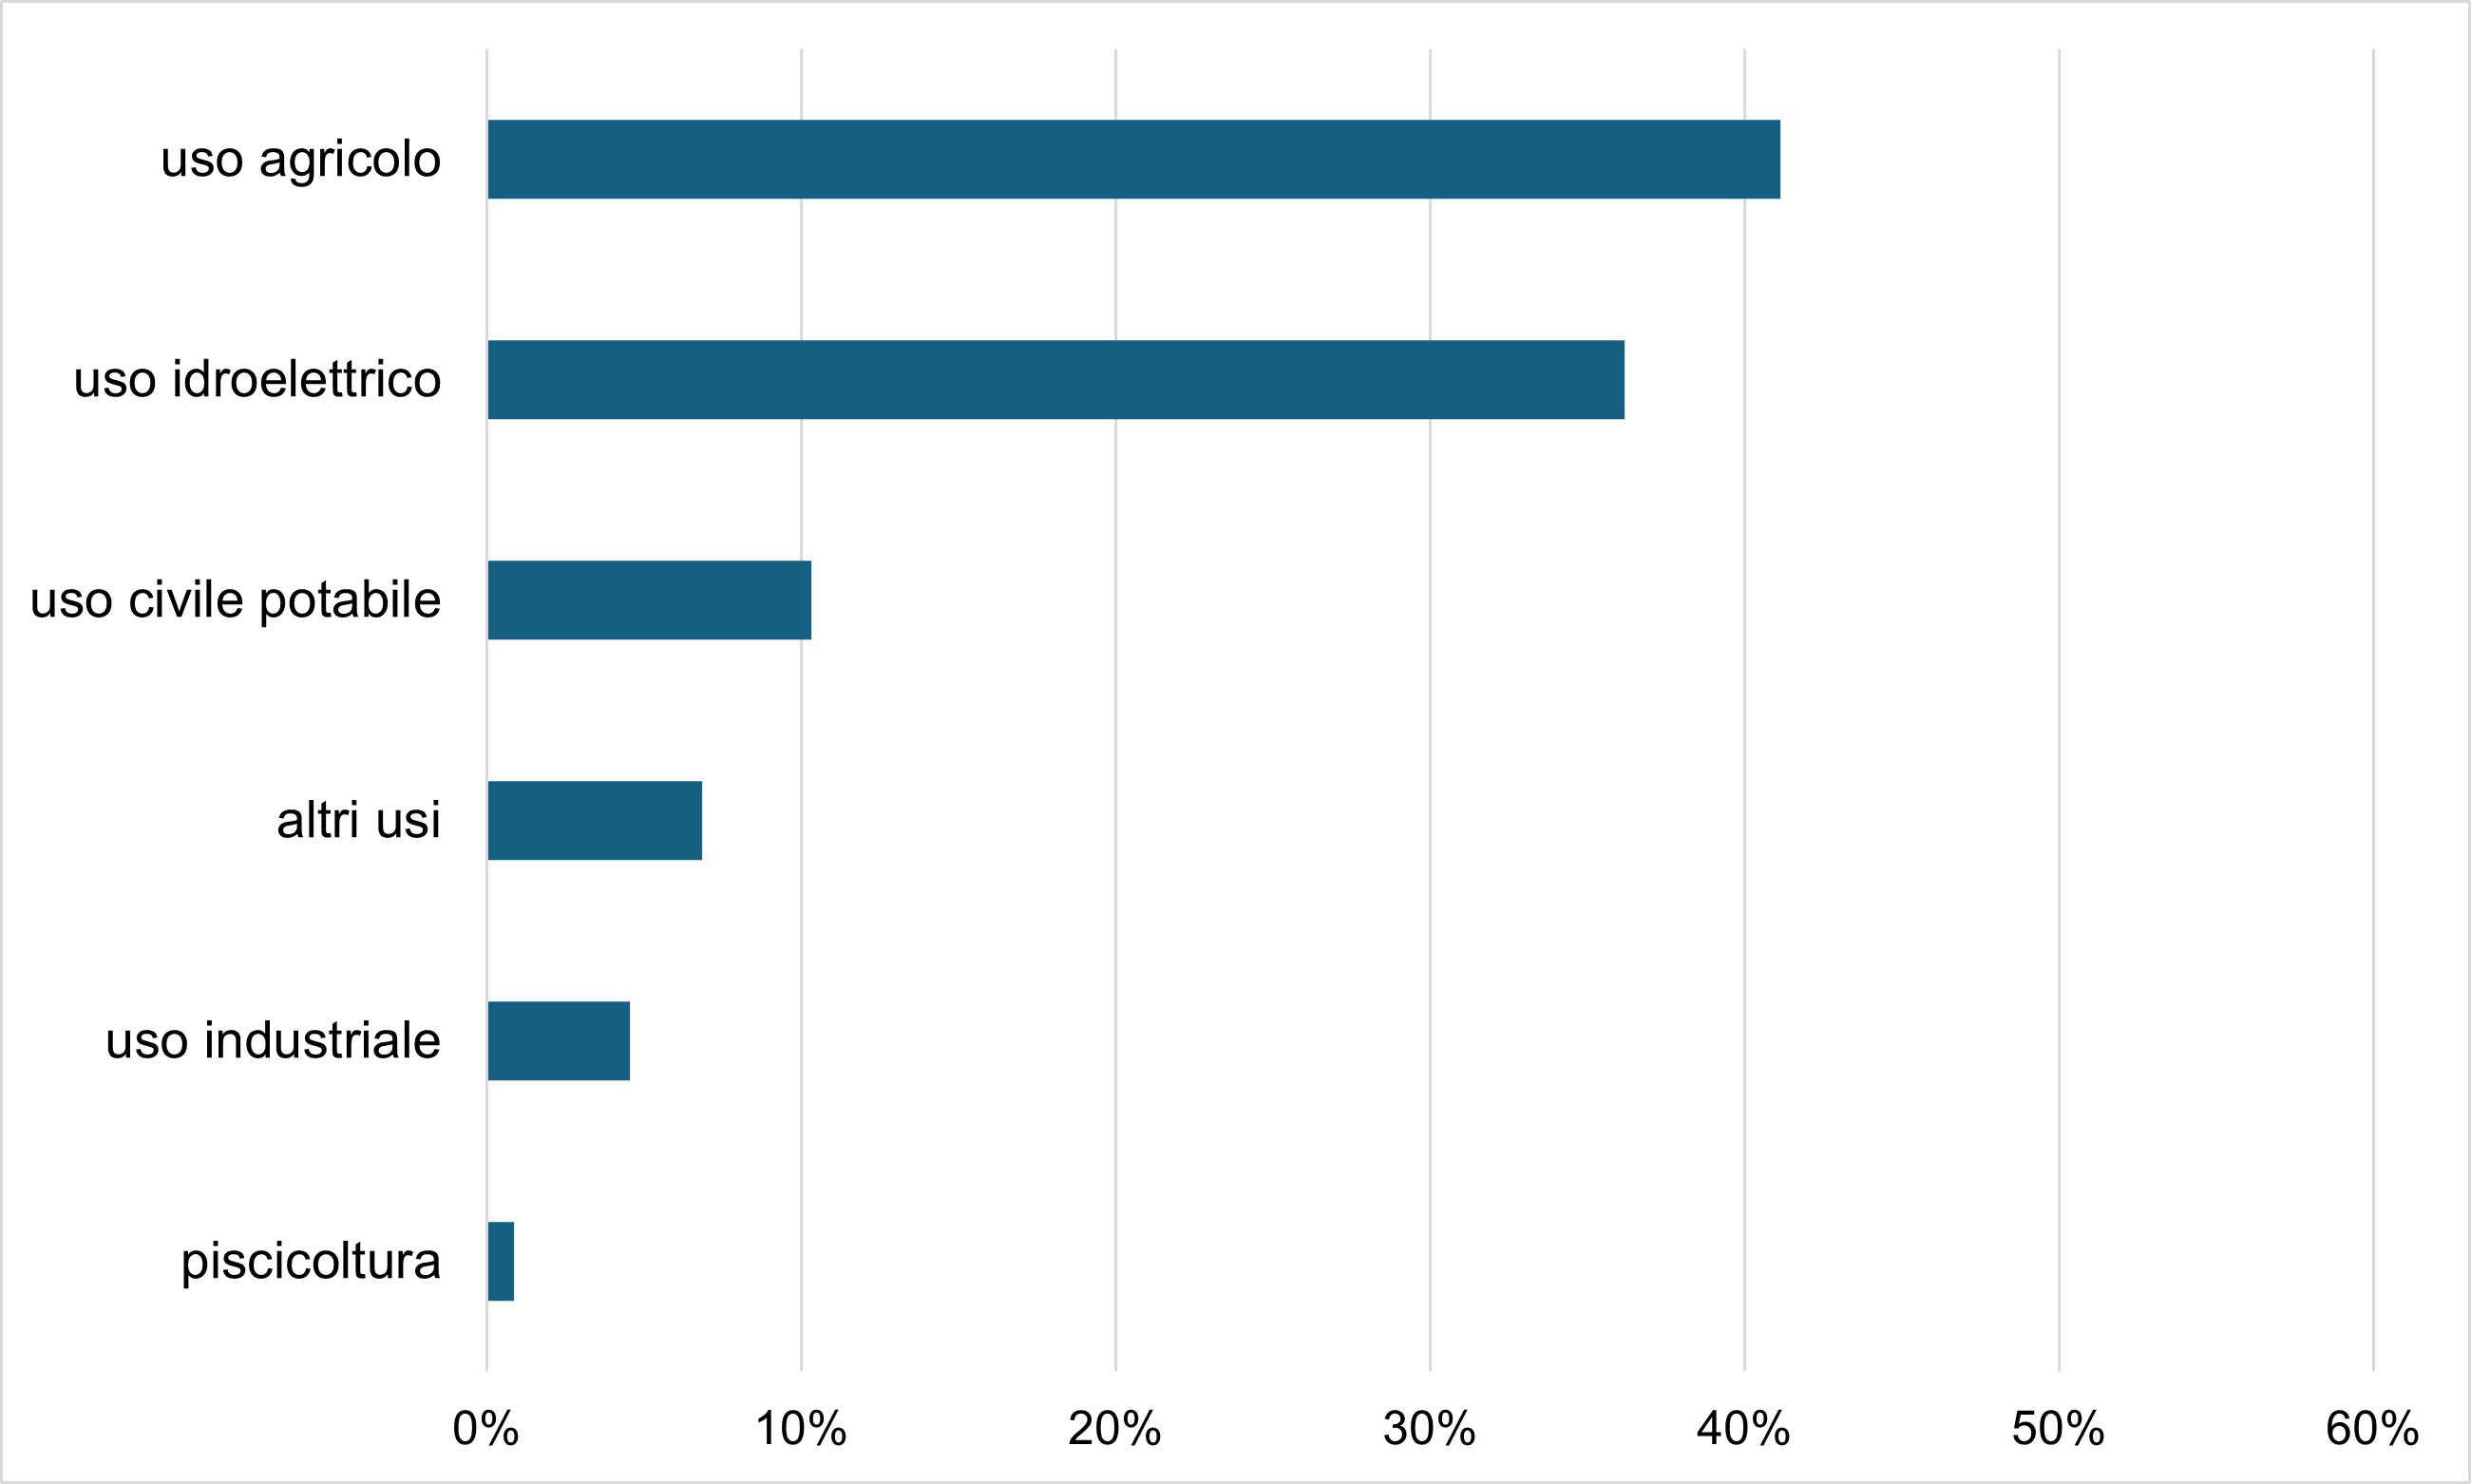
Figure 7a: Withdrawal pressure on surface water bodies - distribution between different uses Data source
ISPRA processing on WISE 2022 reporting data |
Thumbnail
Headline
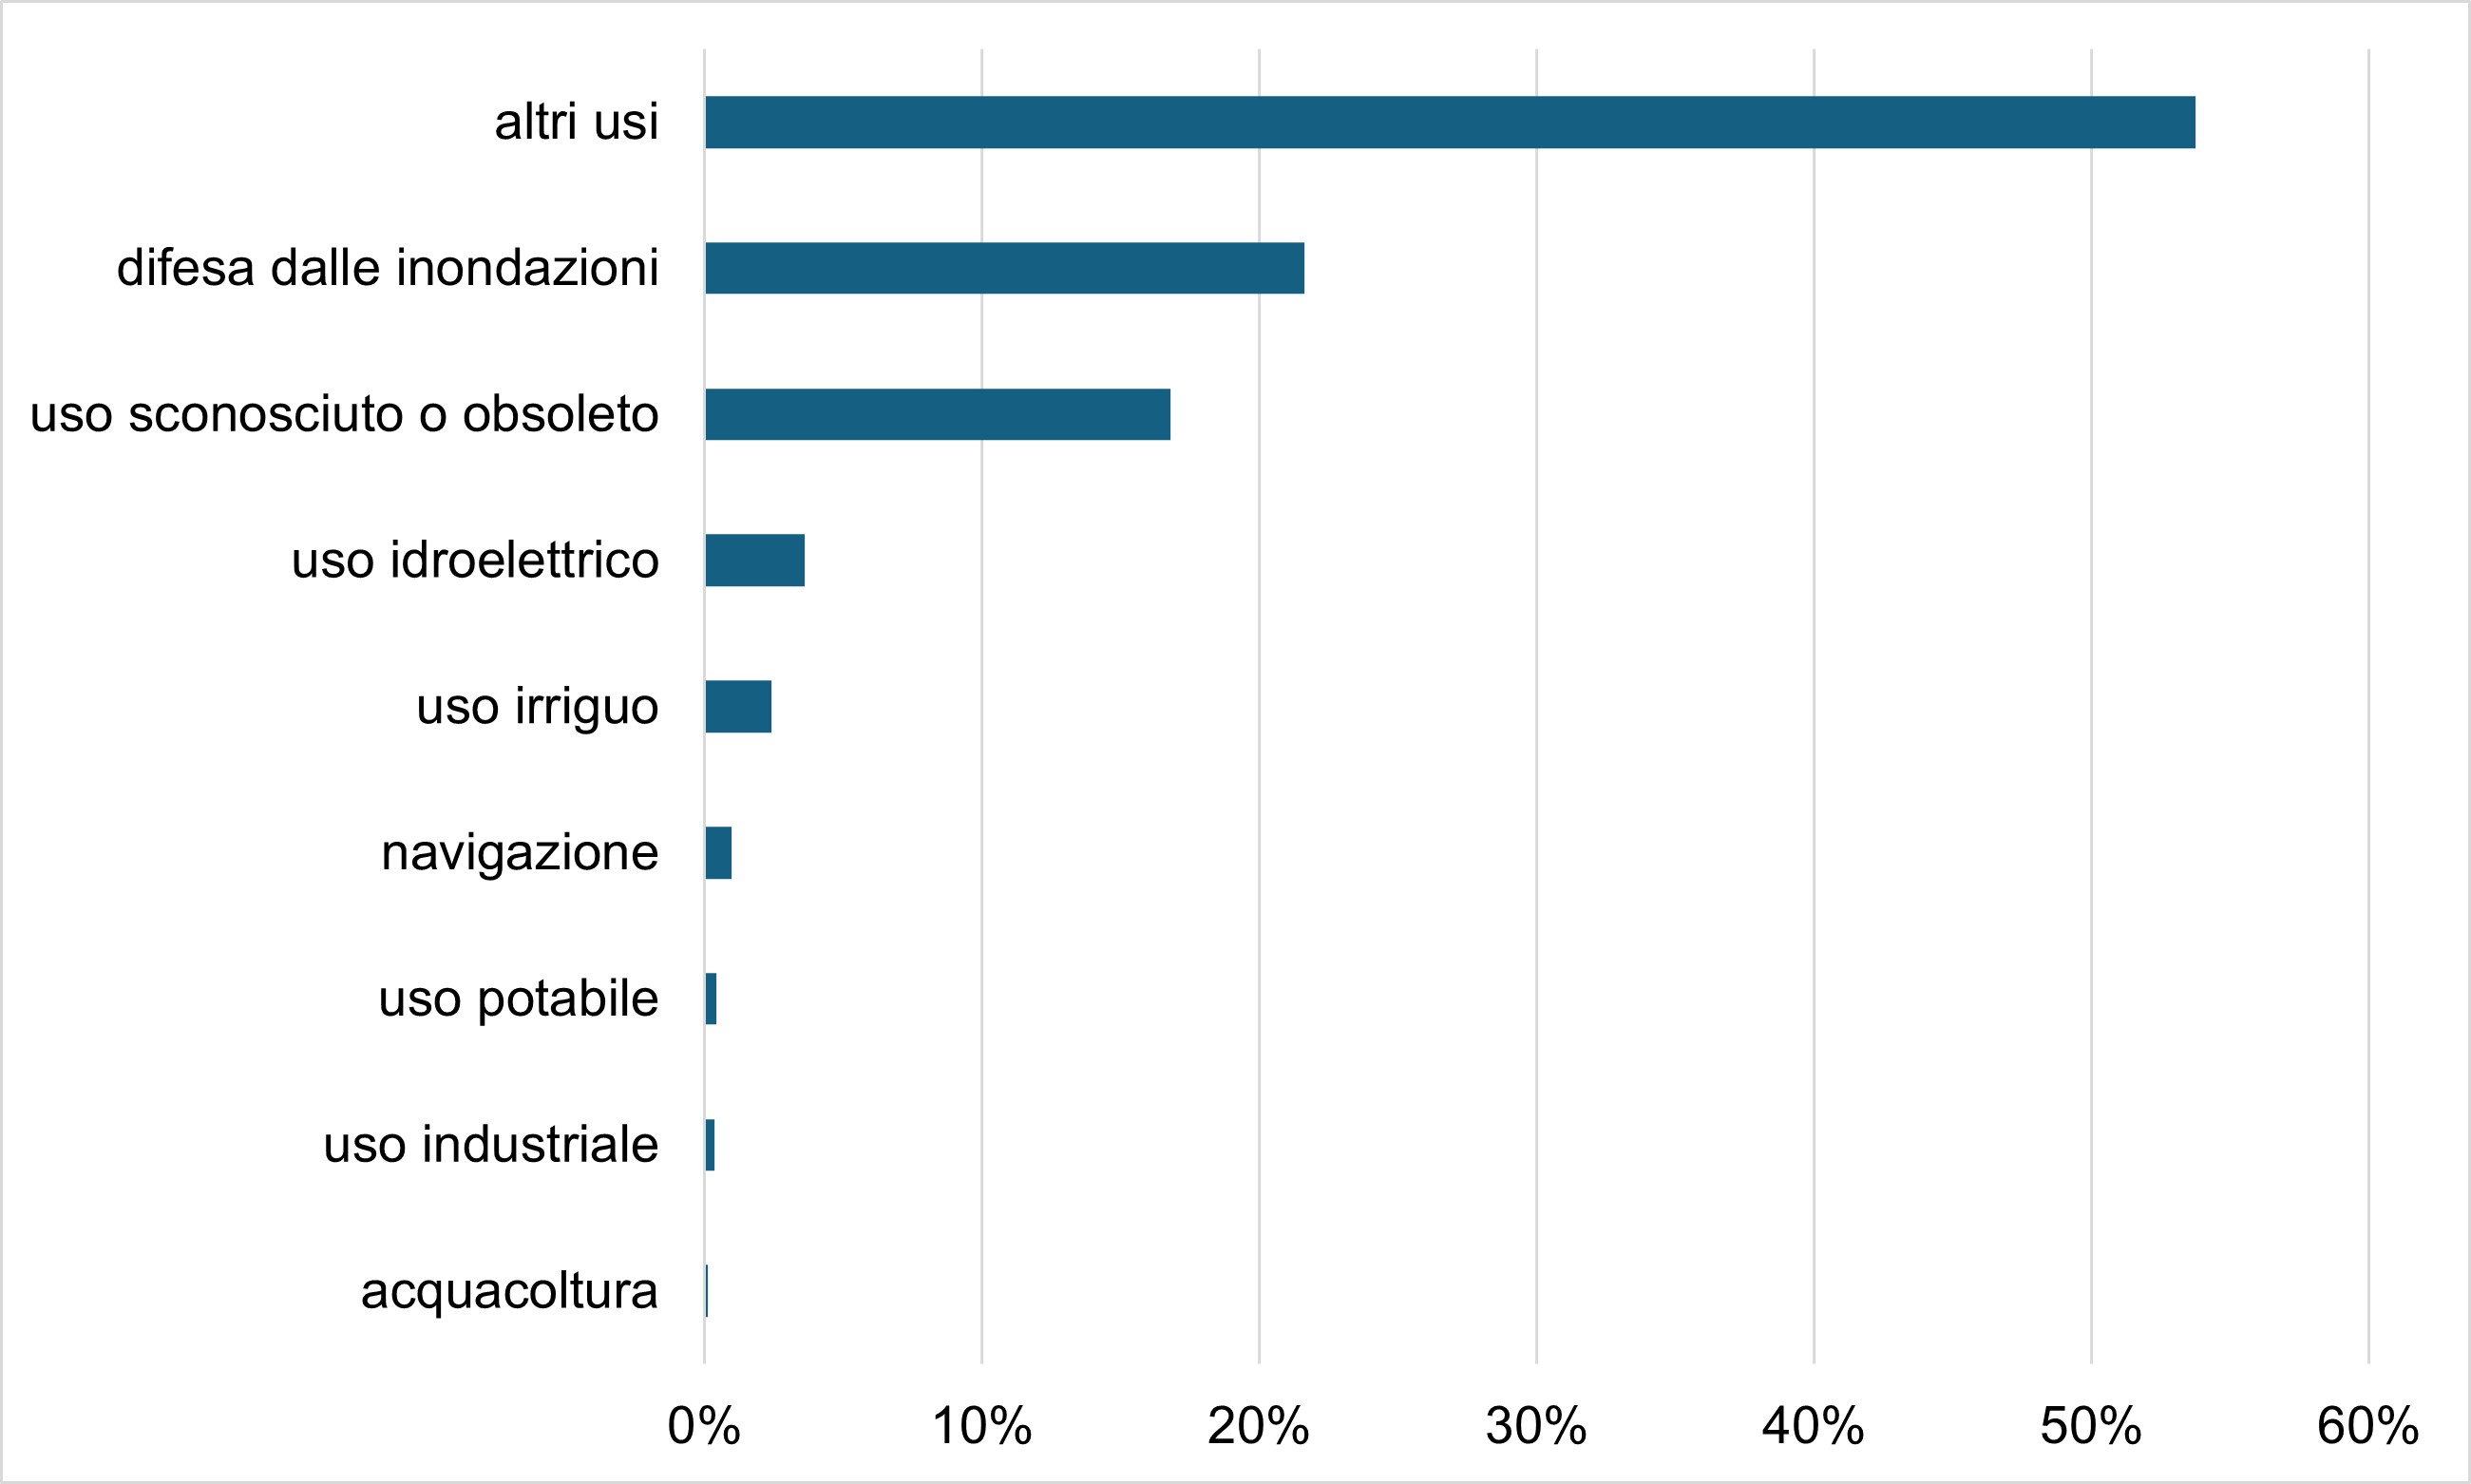
Figure 9: Hydromorphological pressures on surface water bodies - distribution between different uses Data source
ISPRA processing on WISE 2022 reporting data |
Thumbnail
Headline
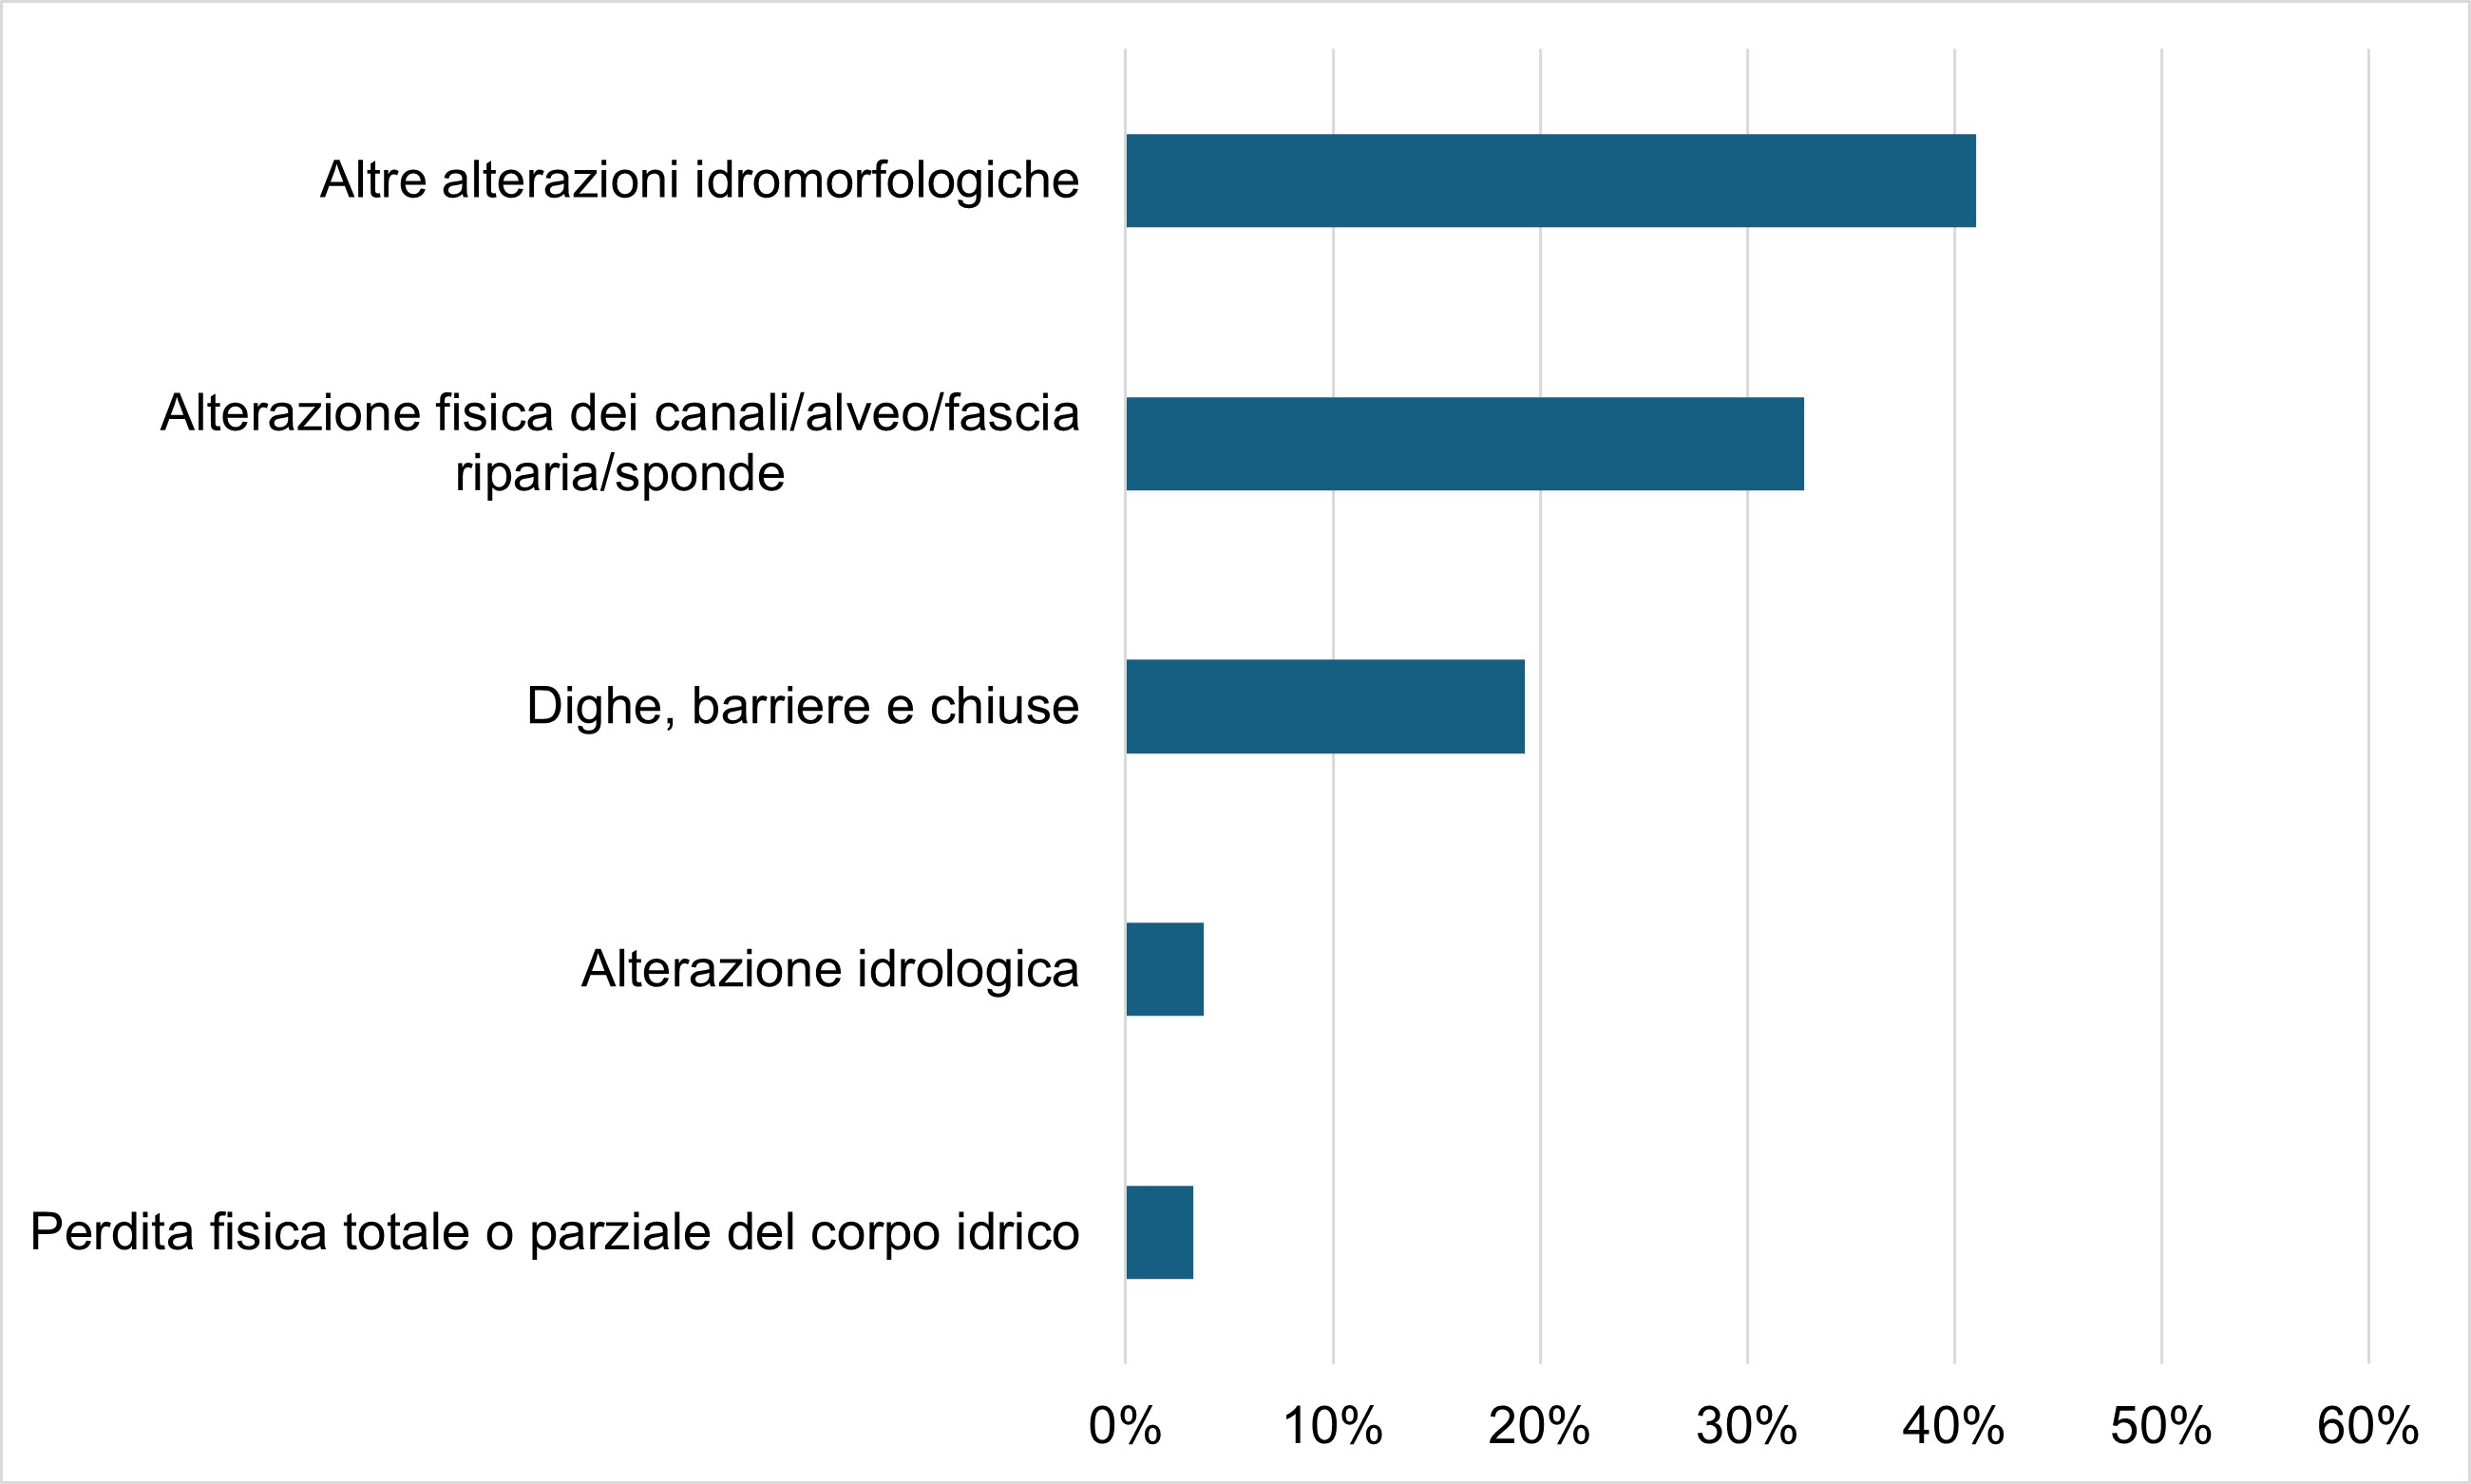
Figure 9: Hydromorphological pressures on surface water bodies - distribution between types of hydromorphological alteration Data source
ISPRA processing on WISE 2022 reporting data |
The processing for calculating the indicator was carried out using different aggregations of the data in order to represent different aspects of the same indicator. The graphs represent the macrotypes of pressure - diffuse, punctual, hydromorphological, withdrawals and generic anthropic pressures - and, for each of them, the prevalent uses.
it should be kept in mind that each body of water can be impacted by more than one significant pressure: for both categories of water (surface and underground) the diffuse pressure prevails. Next, for groundwater there are withdrawals, while for surface water there are hydromorphological and punctual pressures in equal measure (Figure 1a and 1b).
Examining the main macrotypes of pressure by water district, it can be seen that, for surface water bodies, diffuse pressures are prevalent above all in the district of Sicily and, to a lesser extent, in that of Sardinia, and in the Central Apennines district (Figure 2a). For underground water bodies (Figure 2 b), however, the diffuse pressure in Sicily predominates, the withdrawals in the Southern Apennines district and the specific pressures in the Northern Apennines district.
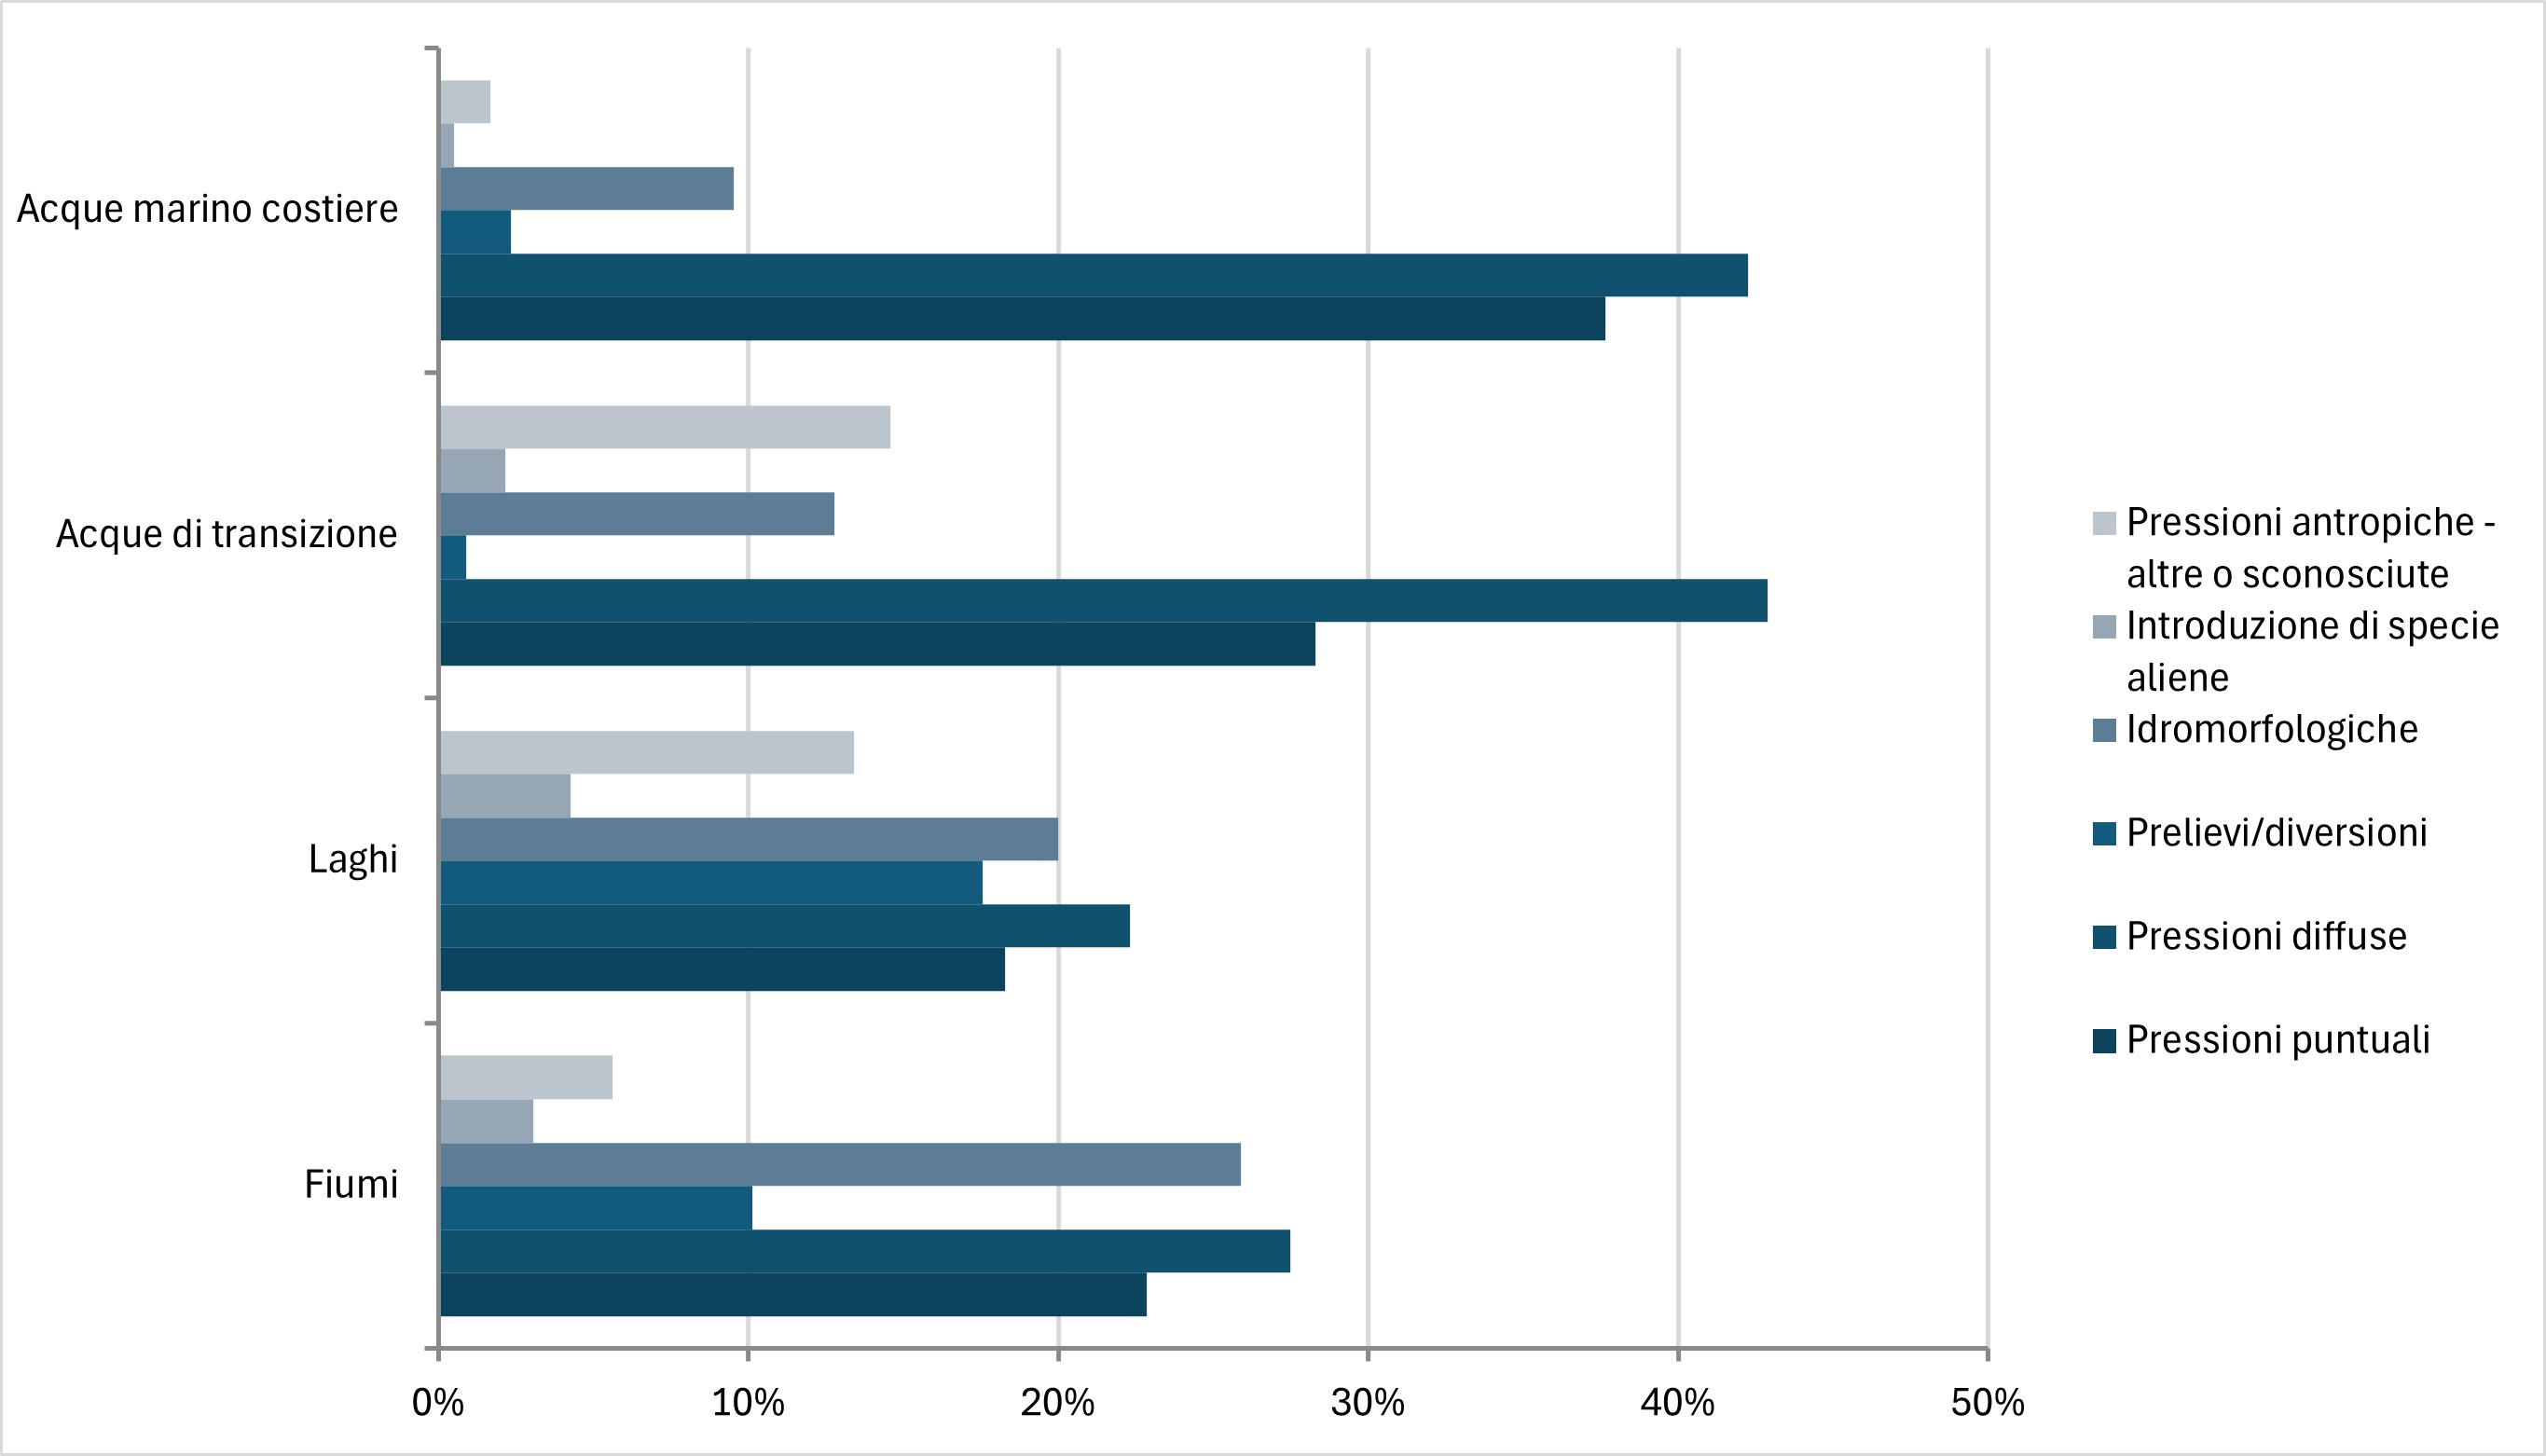
Considering the distribution of the main types of pressure for the four categories of surface waters (Figure 3), it is highlighted that diffuse pressures are prevalent everywhere compared to the others, in particular in transition waters and coastal waters. Lakes are the category of water least subject to pressure on average.
If we analyze the incidence of the determinants, for surface water bodies, agriculture and urban development are predominant (Figure 4a), while for underground water bodies the greatest incidence is due to industry, followed by urban development and agriculture, present, however, with high percentages (Figure 4b).
Taking into consideration the distribution between the different uses of each macrotype of pressure, both for surface and groundwater, it is clear that for diffuse pressures the prevalent use is agriculture, for both categories of water (Figure 5a and Figure 5b), while for punctual pressures urban discharges are clearly predominant compared to other uses for surface waters as well as contaminated sites/abandoned industrial sites for groundwater. For withdrawals, hydroelectric and agricultural uses for surface water are comparable (Figure 7a), agricultural use and civil drinking use for groundwater (Figure 7b).
For hydromorphological pressures, present only for surface water bodies, the prevalent use is a generic "other uses" followed distantly by flood defense (Figure 8). Regarding the types of hydromorphological alterations (Figure 9), the highest percentage occurs for a generic "other hydromorphological alterations".