Marina Penna
In the assessment of the ecological quality of coastal marine environments within the framework of the European Directive 2000/60/EC (transposed by Legislative Decree 152/2006 and subsequent amendments), reference is made to the Biological Quality Element (BQE) Angiosperms. This BQE in Italy, as provided for by the Ministry of the Environment Decree 260/2010, is evaluated through the PREI (Posidonia Rapid Easy Index). In this context, in fact, the meadows of Posidonia oceanica (L.) Delile take on considerable importance in assessing the ecological quality of coastal marine environments, given their wide distribution and sensitivity to sources of disturbance of anthropogenic origin. The classification of this BQE is carried out where, for reasons of geographical distribution, the meadow is present, i.e., in the Tyrrhenian regions and in Apulia. The data analyzed show that more than 80% of the meadows are in "good" or "high" status.
The PREI (Posidonia Rapid Easy Index) is a multimetric index based on univariate statistics. It is based on the analysis of five different descriptors of the Posidonia oceanica meadow under study. From the degree of deviation from reference conditions (Environmental Quality Ratio, EQR), the PREI index provides information on the "ecological status" of the water body and its classification into one of the five classes: "high status," "good status," "moderate status," "poor status," "bad status" (as per Directive 2000/60/EC).
The classification of this BQE is carried out where, for reasons of geographical distribution, the meadow is present, i.e., in the Tyrrhenian regions and in Apulia.
To formulate an ecological quality assessment for coastal marine environments within the framework of the current legislation (Legislative Decree 152/2006 and subsequent amendments), through the use of the Biological Quality Element (BQE) Angiosperms, integrating over time the effects of different causes of physical, chemical, and biological alterations, induced by pollutants in the water and sediments, or by significant physico-morphological alterations of the coastal stretch.
Water Framework Directive (2000/60/EC); Legislative Decree 152/06 “Consolidated Act on Water”; Ministerial Decree 56/09 “Regulation containing «Technical criteria for the monitoring of water bodies and the identification of reference conditions for the amendment of the technical standards of Legislative Decree April 3, 2006, no. 152, containing Environmental regulations, prepared pursuant to Article 75, paragraph 3, of the same Legislative Decree»”; Ministerial Decree 260/10 “Regulation containing the technical criteria for the classification of the status of surface water bodies, for the amendment of the technical standards of Legislative Decree April 3, 2006, no. 152, containing environmental regulations, prepared pursuant to Article 75, paragraph 3, of the same Legislative Decree”.
Class limits defining the thresholds of the Ecological Quality Ratio (EQR):
1 – 0.775 High
0.774 – 0.550 Good
0.549 – 0.325 Moderate
0.324 – 0.100 Poor
< 0.100 – 0 Bad
Gobert, S., Sartoretto, S., Rico-Raimondino, V., Andral, B., Chery, A., Lejeune, P., Boissery, P., 2009. Assessment of the ecological status of Mediterranean French coastal waters as required by the Water Framework Directive using the Posidonia oceanica Rapid Easy Index (PREI). Marine Pollution Bulletin 58, 1727–1733;
Bacci T., Rende S. F., Penna M., Trabucco B., Montefalcone M, Cicero A. M., Giovanardi F., 2013. A methodological approach to understand functional relationships between ecological indices and human-induced pressures: the case of the Posidonia oceanica meadows. Journal of Environmental Management 129, 540-547.
ARPA costiere
Dati EIONET/SOE e Piani di Distretto
www.sintai.isprambiente.it/faces/public/WFD/index.xhtml
Coastal regions
2019-2022
The PREI Index includes the calculation of five descriptors: meadow density (shoots m⁻²); leaf area per shoot (cm² shoot⁻¹); ratio between epiphyte biomass (mg shoot⁻¹) and leaf biomass per shoot (mg shoot⁻¹); depth of the lower limit and type of the lower limit.
Meadow density, leaf area per shoot, and the ratio between epiphyte biomass and leaf biomass are assessed at the standard depth of 15 m; in cases where the bathymetric development of the meadow does not allow sampling at the standard depth, an appropriate depth specific to the case may be chosen, with a justification.
The method for calculating the PREI index involves applying the following equation:
EQR = (EQR’ + 0.11)/(1 + 0.10)
where EQR’ = (Ndensity + Nleaf area per shoot + Nepiphyte biomass/leaf biomass + Nlower limit)/3.5
where:
- Ndensity = (measured value – 0) / (reference value – 0), where “0” is the value indicating poor conditions.
- Nleaf area per shoot = (measured value – 0) / (reference value – 0), where “0” indicates poor conditions.
- Nepiphyte biomass/leaf biomass = [1 – (epiphyte biomass/leaf biomass)] * 0.5.
- Nlower limit = (N' – 12) / (reference depth value – 12), where 12 m is considered the minimum lower limit depth indicating poor conditions.
- N' = measured depth of the lower limit + lambda, where
- lambda = 0 (stable lower limit),
- lambda = 3 (progressive lower limit),
- lambda = -3 (regressive lower limit).
For classification purposes, the conclusions shared at the EU level, which all classification indices (including PREI) adhere to, are reported below:
- Identification of "bad" status
“Bad” status is identified under environmental conditions incompatible with the survival of Posidonia oceanica; in particular, it corresponds to a recent (< 5 years) disappearance of the meadow. - Definition of EQR intervals
The “poor-bad” interval value has been arbitrarily set at 0.1; not wishing to create unequal classes, the remaining EQR scale was thus divided into four equal parts.
More than 80% of the analyzed stations fall within the “good” and “high” status; however, 18% of stations are in “moderate” status, therefore below the regulatory target (achievement of “good” status).
The trend is not yet definable due to the lack of robust time series data.
| Data |
|---|
Thumbnail
Headline
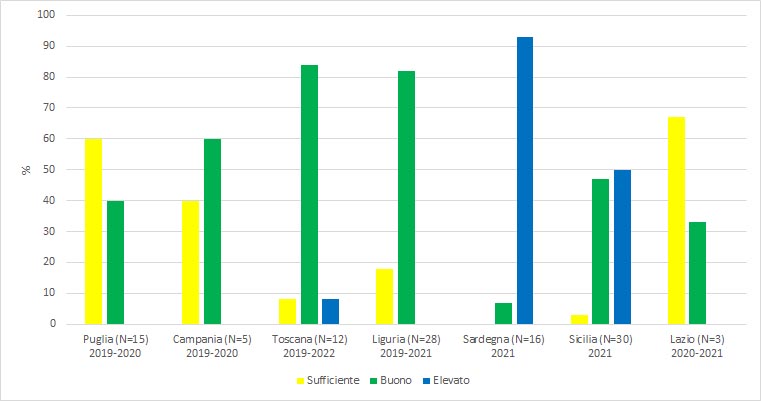
Figure 1: Ecological classification of stations by region according to the EQB Angiosperms (PREI) (2019-2022) Data source
Sintai Eionet SoE |
Thumbnail

Headline
Figure 2: National Ecological Classification of Stations Based on EQB Angiosperms (PREI) (2019-2022) Data source
Sintai Eionet SoE |
The data for the period 2019–2022 show good national coverage. However, there is some heterogeneity regarding the number of classified stations per region analyzed, ranging from a minimum of 3 in Lazio to a maximum of 30 in Sicily (Figure 1). The region with the highest percentage of stations in “moderate” status is Apulia (60%), while only in Sardinia, Sicily, and Tuscany are there stations in “high” class (Figure 1).
However, the data relating to the Apulian meadows is open to interpretation because the peculiar biogeographical situation of this region gives the meadow a singular morpho-functional structure, which only partially allows for a meaningful comparison with the reference conditions imposed by current legislation.
In summary, at the national level, for the period 2019–2022, more than 80% of stations reached the quality standard (at least “good”) (Figure 2).