Antonio Caputo, Monica Pantaleoni
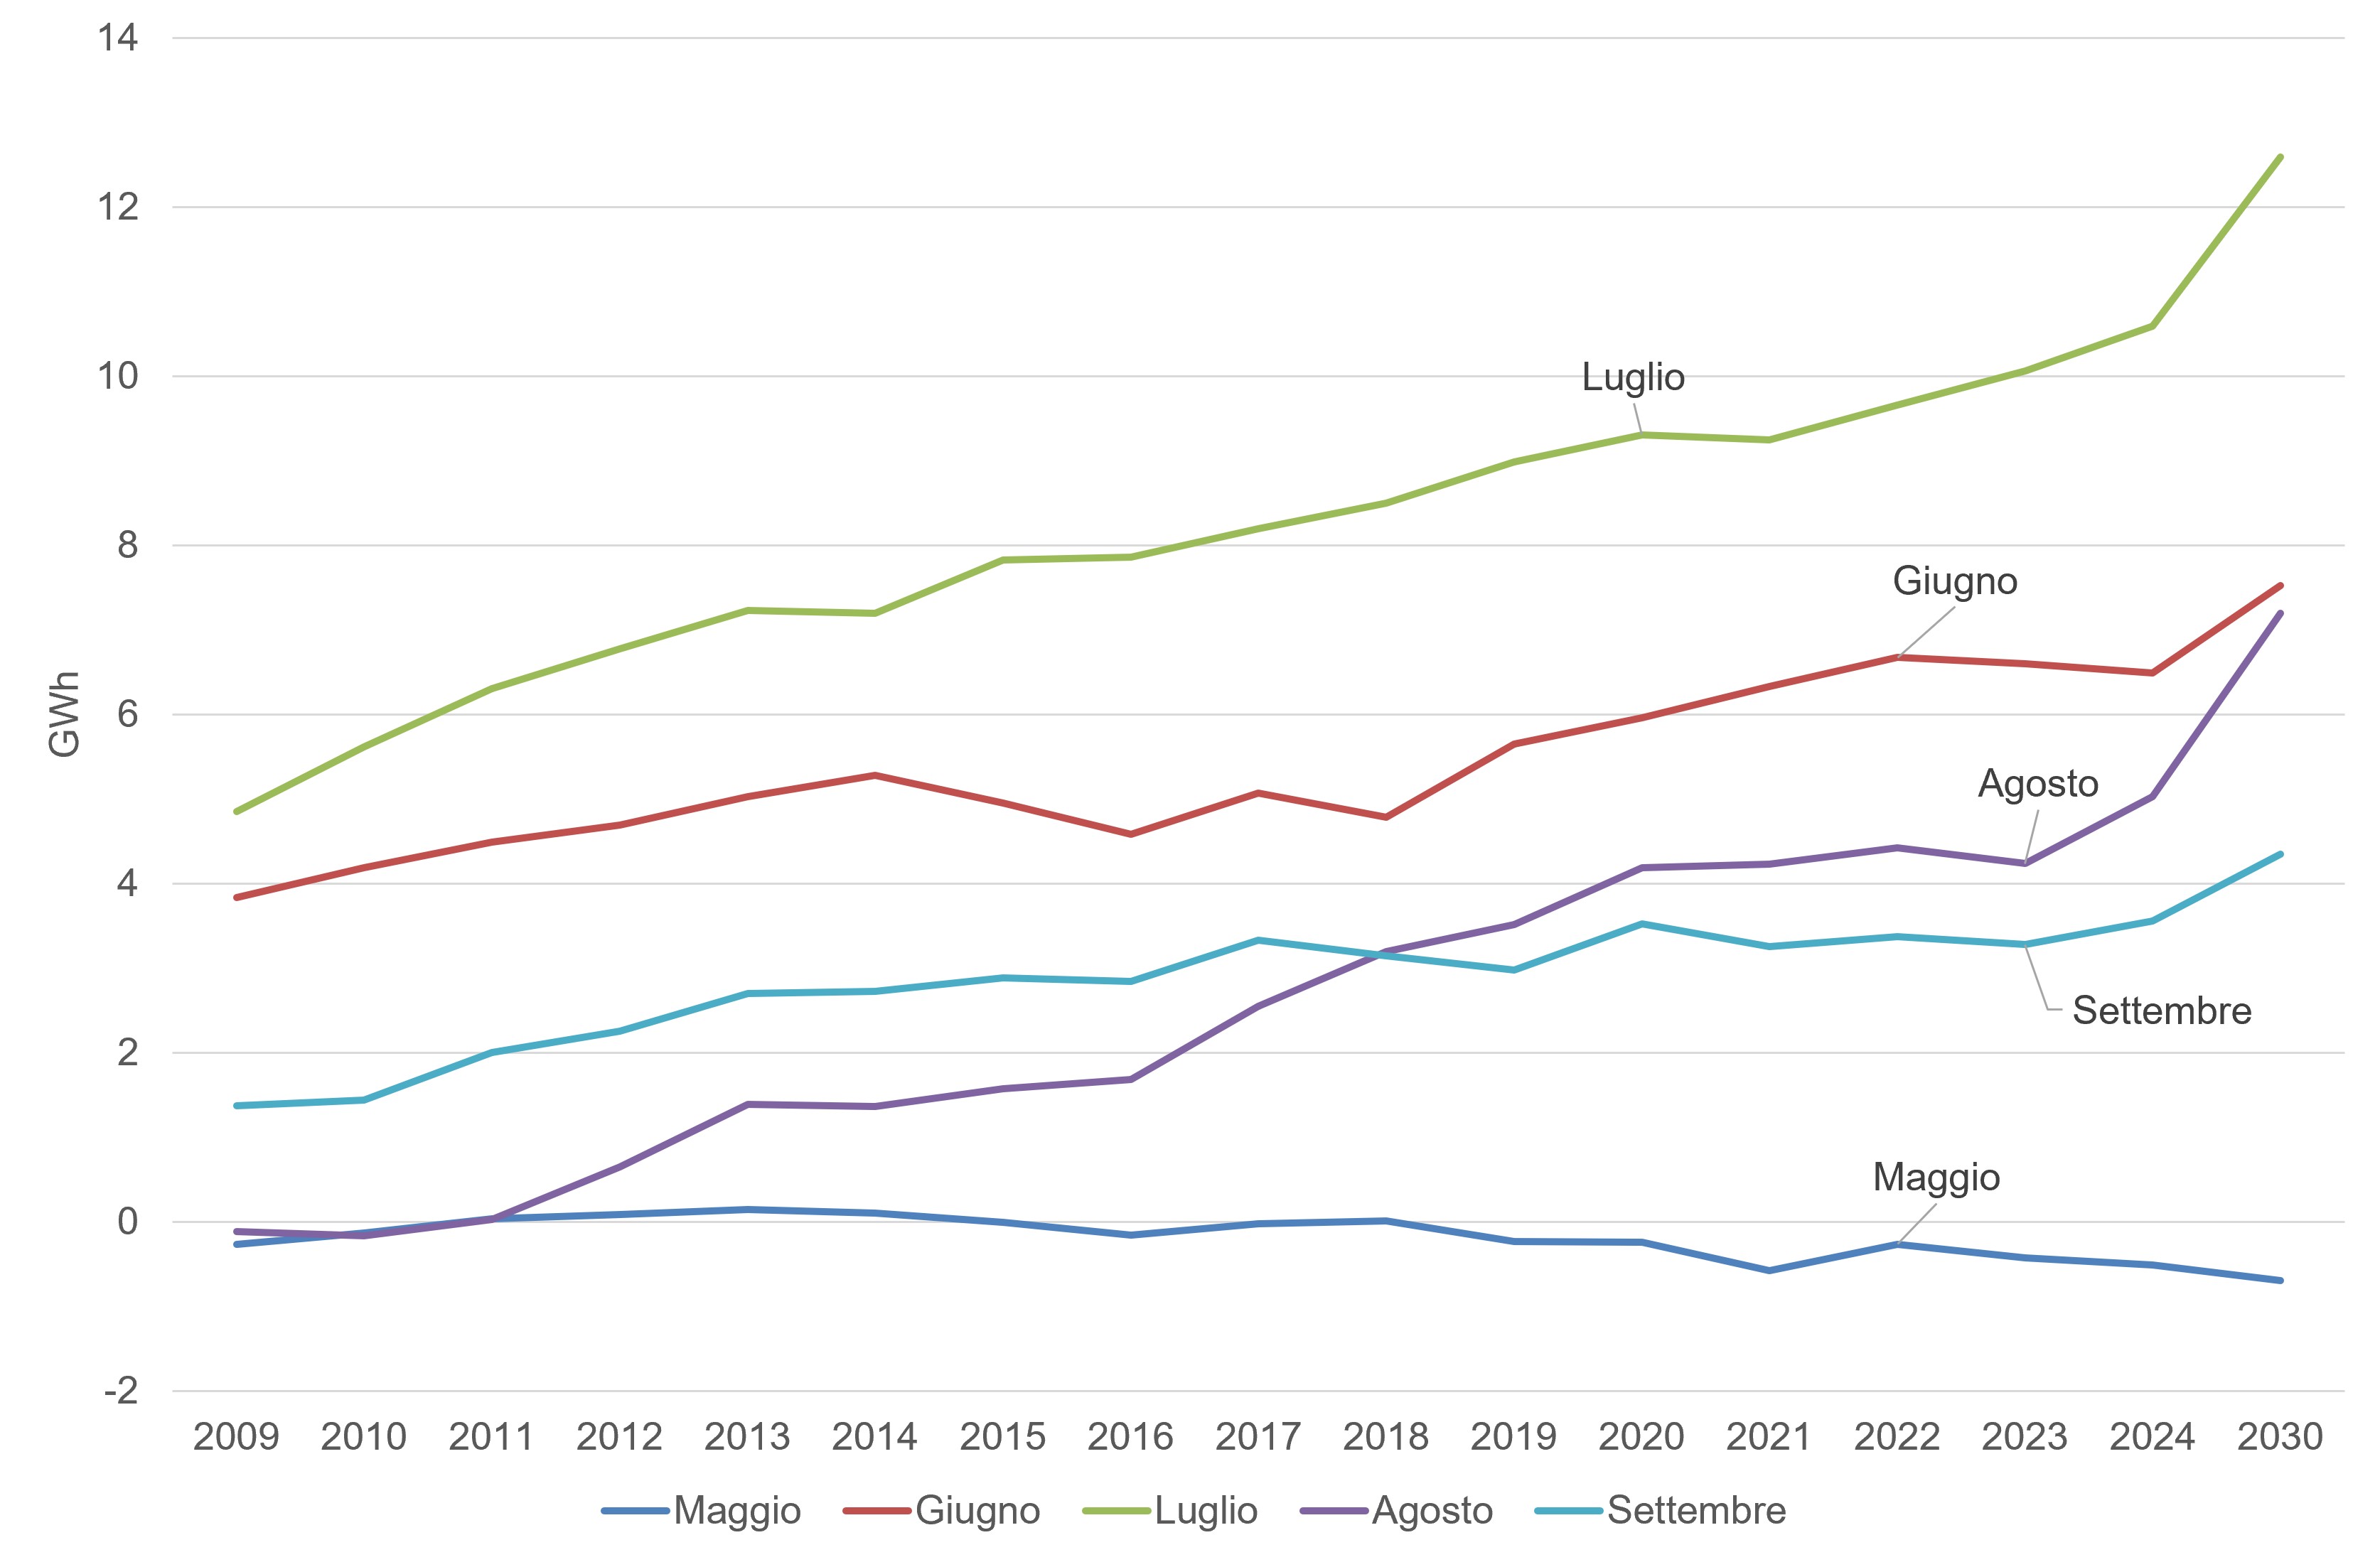
The indicator provides information on the variation in hourly peak electricity demand during the summer period (May–September) for cooling, compared with peak demand arising from all other uses. The figures show an upward trend over the period analysed, with varying rates across the different months and particularly significant increases in June and July. In 2000, peak values ranged from 43.30 GW in May to 47.38 GW in July, whilst in 2024 the maximum power consumption reached 57.81 GW in July, confirming a structural increase in peak load driven by summer air conditioning. With the rise in global average temperatures, future scenarios predict a reduction in energy consumption for space heating and an increase for space cooling: the overall effect on energy demand will depend on the trend in local and seasonal meteorological parameters as well as on the structure of the energy supply.
The indicator provides information on the variation in hourly peak electricity demand during the summer period (May–September) for cooling, compared with peak demand resulting from all other uses. Peaks in electricity demand during this time of year depend on various factors, including the cooling of buildings. As temperatures rise, there is an increase in the use of cooling systems and, consequently, in electricity demand.
To assess the variation in hourly peak electricity demand at national level during the period from May to September, excluding consumption for other purposes.
The indicator has no direct links to regulatory provisions. However, the regulatory framework governing the management and safety of the electricity grid during peak periods includes Legislative Decree 79/1999 (the Bersani Decree), which entrusts Terna S.p.A. with national transmission and dispatching functions. This is complemented by Terna’s Network Code, approved by ARERA, which governs the criteria for system adequacy and safety, Legislative Decree 93/2011 on the security of electricity supply, and the Ministerial Decree of 28 October 2019, which introduced the Capacity Market to ensure the availability of programmable power during periods of peak summer and winter demand.
This indicator is not directly linked to climate change, as it is also influenced by non-climatic factors. However, it can be regarded as a relevant indicator for the issue of climate change impacts; in other words, it can provide useful insights into the study of the effects of rising average temperatures on energy demand for cooling.
Any measures aimed at filling gaps in our understanding and improving the interpretation of the indicator could involve extending the time series of data to cover at least the decade 1990–1999. Furthermore, analyses of the correlation with temperature trends could help to better understand the impact that temperature has on peak electricity demand in summer.
Terna - Rete Elettrica Nazionale S. p. A.
Terna SpA - Statistica annuale della produzione e del consumo di energia elettrica in Italia
https://www. terna. it/it/sistema-elettrico/statistiche/pubblicazioni-statistiche
Nation
2000-2024
Terna S.p.A. provides the monthly peak demand figure. The peaks for the summer months are subtracted from the average of the peaks recorded in April and October. These latter months are considered representative of consumption excluding heating.
In 2024, monthly peaks stood at 44.70 GW in May, 51.51 GW in June, 57.81 GW in July, 55.75 GW in August and 52.16 GW in September. July proved once again to be the period of greatest strain on the national electricity system, closely followed by a month of August that was particularly high compared with the historical average (Table 1).
Between 2000 and 2007, peak power experienced steady and sustained growth, exceeding the 56 GW threshold for the first time in July 2007 (56.59 GW). Between 2008 and 2016, there was a period of stabilisation and decline, influenced by the economic crisis and the fall in industrial consumption. From 2017 to 2024, the trend shows a renewed consolidation of summer peaks at high levels (steadily between 55 GW and 58 GW in July), with demand also extending into August and September due to rising average temperatures and the prolongation of the hot seasons.
| Data |
|---|
Headline
Table 1: Hourly peak energy demand during the summer months Data source
ISPRA analysis based on TERNA data |
Thumbnail
Headline
Figure 1: Hourly peak energy demand during the summer months Data source
ISPRA analysis based on TERNA data |
The trend in summer peaks highlights the profound transformation of Italy’s load profile. The high concentration of demand in July and August requires an increasingly flexible and resilient system, capable of managing steep load ramps. The upward trend in energy demand peaks during the summer season is undoubtedly linked to the ever-increasing use of air-conditioning systems, which are now widespread in public buildings as well as in private homes. The observed peaks in electricity demand (Table 1 and Figure 1) are becoming increasingly high over time and, in all likelihood, will exceed typical winter levels in the coming decades, resulting in record consumption figures. The stability of the energy system will therefore be essential to ensuring the required energy supplies. Among the key factors driving this phenomenon are undoubtedly the rise in average summer temperatures and the occurrence of heatwaves. In this regard, the indicator is considered relevant in terms of the impacts of climate change, given a future scenario that is very likely to be characterised by higher temperatures and more frequent heatwaves in the Mediterranean region.