Antonio Caputo
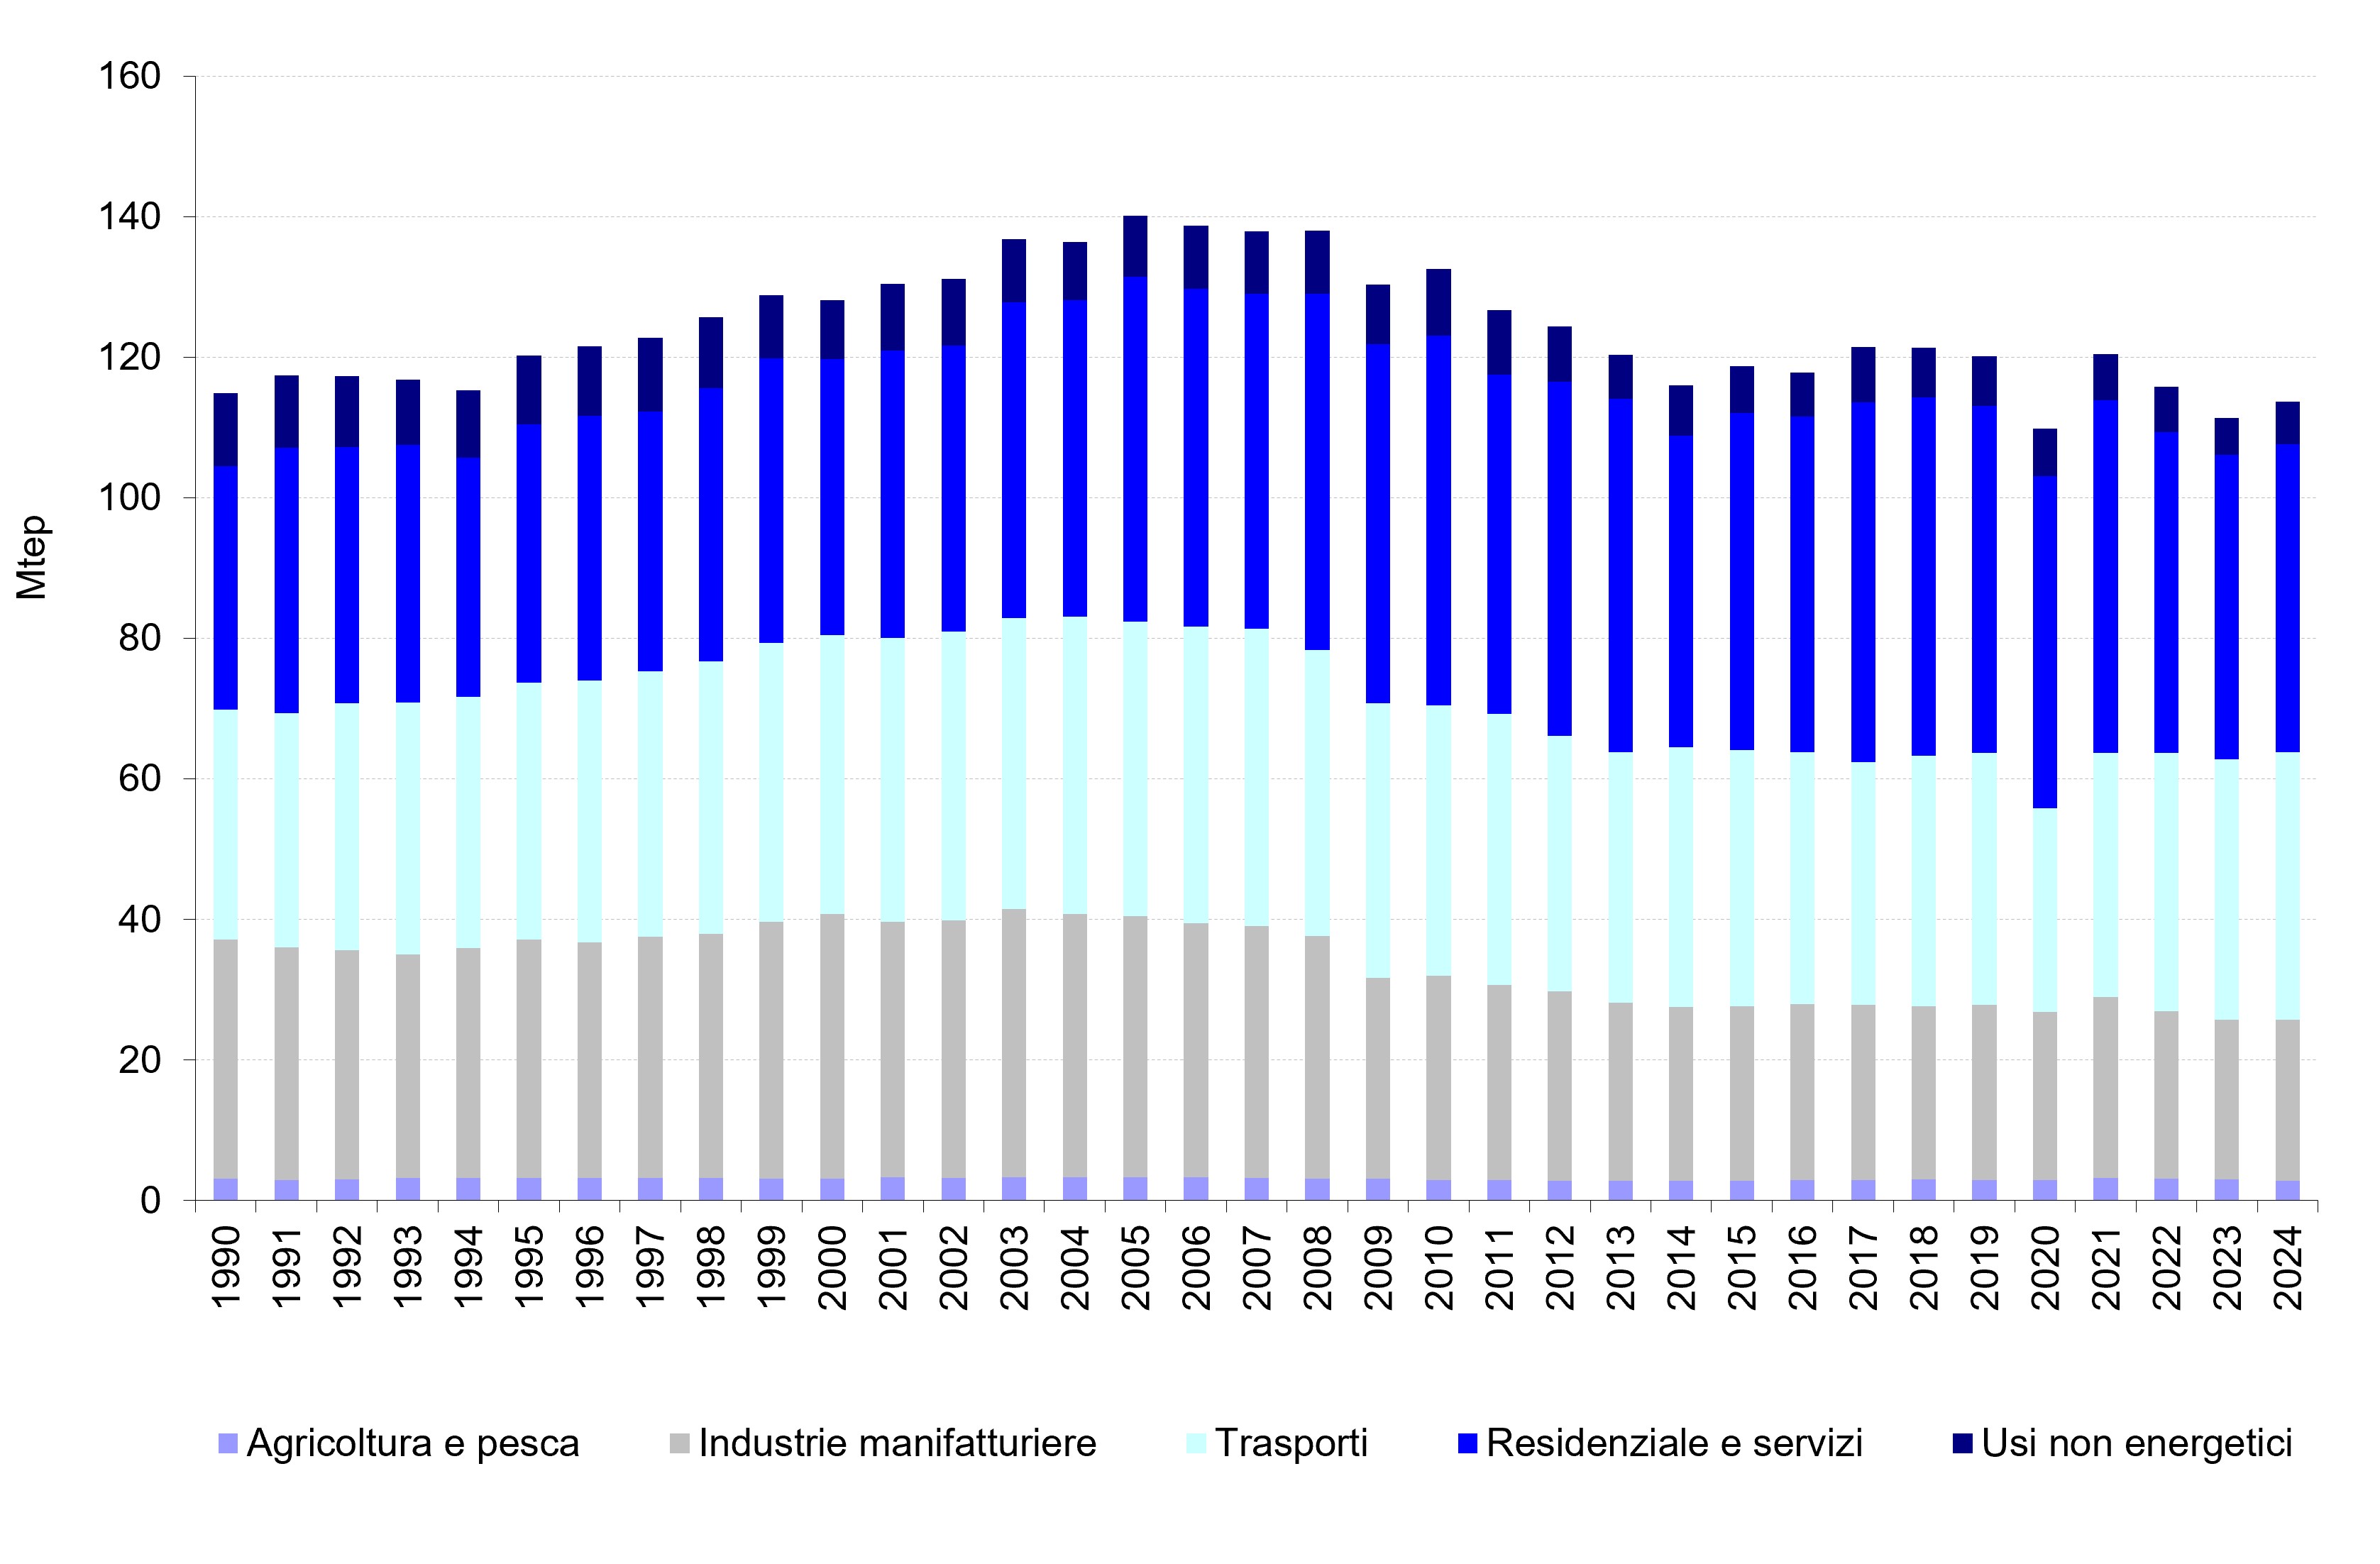
The indicator measures the energy consumed by end users and the total energy consumed by the country. Since 1990, there has been an increasing trend in energy available for final consumption, with a peak reached in 2005 of 139 Mtoe. Subsequently, a reversal of the trend was noted, reaching a minimum reached in 2014 (114 Mtoe). Until 2018, a recovery in final consumption was observed, followed by a decline in 2019 and a sudden reduction in 2020 due to the lockdown of economic activities to contain the spread of the SARS-CoV-2 pandemic, followed by a recovery in consumption in 2021, and then a decline in the following two years. In 2024, the energy available for final consumption, accounted for according to the methodology adopted by Eurostat, is equal to 109.3 Mtoe, +0.4% compared to 2023.
The indicator, calculated according to the Eurostat methodology, provides information on the energy needs of the entire national economy, for the different sectors.
Evaluate the trend in total energy consumption at a national level and by sector, in order to reduce its use.
The European Union has consolidated its strategic framework for the climate through the "Fit for 55" package, which sets extremely clear binding objectives for 2030. Among these stand out the reduction of greenhouse gas emissions by at least 55% compared to 1990, the achievement of a share of renewable energy equal to at least 42.5% of final consumption - with the RED III Directive pushing towards the 45% target - and an 11.7% reduction in final energy consumption compared to the projections of the 2020 reference scenario, as envisaged by the EED Recast Directive (EU Directive 2023/1791).
In this context, Italy has sent the updated and definitive version of the National Integrated Energy and Climate Plan, the PNIEC, to the European Commission. This document absorbs previous programmatic plans and defines concrete measures to align with European efficiency, renewables and decarbonisation targets. Despite the additional measures introduced, the PNIEC highlights a distance from the more stringent goals of the EED III Directive. In fact, the Plan estimates for Italy a consumption of 102 Mtoe of final energy and 123 Mtoe of primary energy by 2030, against calculated objectives which would require a reduction to 93 and 111 Mtoe respectively.
The mandatory schemes linked to energy efficiency remain confirmed. Through specific active policies, the country aims for an annual reduction in final consumption, between 2021 and 2030, equal to 0.8% of the average for the three-year period 2016-2018. This effort translates into an overall saving of 73.42 Mtoe cumulatively by the end of the decade.
The national and community regulatory framework has evolved in step with these goals. If for the 2020 objectives the main point of reference was Legislative Decree 102/2014, amended by Legislative Decree 73/2020 to implement the old Directive 2018/2002/EU, the transition towards 2030 is today guided by updated texts. In addition to EU Regulation 2018/1999 on the Governance of the Energy Union, Directive 2023/1791 on energy efficiency and Directive 2023/2413 on renewables play a central role. Finally, the construction sector refers to the recent Directive 2024/1275, known as EPBD IV or "Green Houses", which supersedes the previous Directive 2018/844 implemented in Italy with Legislative Decree 48/2020, introducing even more stringent standards for the decarbonisation of buildings.
European Environment Agency, Energy and Environment in the European Union, Environmental issue report, No. 31, 2002
European Energy and Transport Trends to 2030–2007 update. European Commission DG TREN. Office for Official Publications of the European Communities, Luxembourg, 2008
ENEA, Regional energy balances
MASE, National Energy Balance, various years, https://dgsaie. mise. gov. it/bilancio-energetico-nazionale
MASE, 2025, The national energy situation in 2024, https://sisen. mase. gov. it/dgsaie/situazione-energetica-nazionale
Since January 2019, Eurostat has updated the historical series by adopting a new methodology in which the main change is represented by the shift of part of consumption from the steel sector to transformation; a further methodological change occurred from 2021, in relation to the accounting of fuel consumption for the self-production of heat in the industrial sector, previously accounted for in transformation. Therefore, the data presented is not comparable with previous editions.
Eurostat (Statistical Office of the European Communities)
MASE (Ministry of the Environment and Energy Safety)
MASE, National energy balances, https://dgsaie. mise. gov. it/bilancio-energetico-nazionale
EUROSTAT, http://ec. europa. eu/eurostat/data/database
National
1990-2024
The processing of consumption, since 2015, follows the Eurostat methodology and concerns the entire historical series. Since January 2019, Eurostat has updated the historical series by adopting a new methodology in which the main change is represented by the shift of part of consumption from the steel sector to transformation.
The historical trend between 1990 and 2024 reveals a parabolic trajectory, characterized by constant growth in demand until the absolute peak recorded in 2005 (when Gross Domestic Consumption reached 189 Mtoe and final consumption 131 Mtoe), which was followed by a structural contraction interrupted only by temporary rebounds. The most macroscopic data of this thirty years is the vertical and progressive collapse of the Industry, which went from 34,093 ktoe in 1990 to 22,901 ktoe in 2024 (-32.8%), with historical sectors such as Chemicals and Petrochemicals which have more than halved (from 6,844 to 2,845 ktoe). On the contrary, the Services sector experienced a mirror-image and unstoppable surge, going from 8,174 ktoe to 16,977 ktoe, recording growth of more than 107%. Transport followed the general trend, reaching the maximum in 2007 (42,315 ktoe) and artificially collapsing in 2020 due to the pandemic (28,976 ktoe), to then rise again and stabilize at 38,138 ktoe, a value still higher than that of 1990. Finally, Residential, after reaching its peak in 2010 with over 35,000 ktoe, has shown a constant decline in recent years, returning in 2024 (26,782 ktoe) almost to its historical start levels.
| Allegati |
|---|
Titolo
Tabella 1: Consumi finali e totali di energia per settori Fonte
MASE, EUROSTAT |
Thumbnail
Titolo
Figura 1: Consumi finali di energia per settore economico Fonte
MASE, EUROSTAT |
Italy has experienced a socio-economic change which has seen the contraction of heavy and energy-intensive industry in favor of the development of the service sector. The decrease in industrial energy consumption, in fact, does not only derive from the efficiency of production processes, but reflects the closure or downsizing of important national chemical and steelmaking hubs. On the opposite front, the explosion of services illustrates the digitalisation and proliferation of offices and commercial infrastructures typical of recent decades. The Transport sector confirms itself as the most rigid and difficult link to decarbonise: the increase in the circulation of goods, logistics and the boom in international flights (aviation has almost tripled) have nullified the technological progress and efficiency of individual engines. Finally, the performance of the Residential sector and the generalized declines in the two-year period 2022-2024 show the system's reaction to exogenous shocks: on the one hand the structural effectiveness of the thermal insulation and building redevelopment policies launched around 2010, on the other the impact of the recent energy price crisis, which forced families and businesses to drastically and forcefully optimize consumption for economic reasons.