Angelo Santini, Fabio Tatti
In 2024, national municipal waste (MW) generation stood at just over 29.9 million tonnes, increasing by 2.3%, corresponding to 664 thousand tonnes, compared with 2023.
The indicator measures the total quantity of municipal waste generated in Italy, disaggregated at regional level.
To measure the total and per capita quantity of municipal waste generated.
State of implementation and effectiveness of regulatory and technical measures concerning municipal waste, with particular reference to the provisions laid down in Part IV of Legislative Decree No. 152/2006 and the related implementing instruments deriving therefrom, including, for example, the National Waste Prevention Programme and regional waste prevention programmes, as well as the National Waste Management Programme and regional waste management plans.
ISPRA - Rapporto Rifiuti Urbani (various editions)
ISPRA, Italian Institute for Environmental Protection and Research.
Data on the production of urban waste on a national scale, by geographical, regional, provincial and municipal macro area can be freely consulted and downloaded on the website www. catasto-rifiuti. isprambiente. it
National, regional
1995-2024
On 26 May 2016, the Ministry of the Environment, Land and Sea Protection issued a specific decree containing guidelines for calculating the separate collection rate of municipal waste. This decree introduced changes to the accounting methods for municipal waste generation and separate collection data, adopting a methodological approach different from that previously used by ISPRA and on the basis of which data had been processed up to 2015.
In particular, the decree includes in the collection data certain waste flows originating from removal activities carried out in residential dwellings. These flows had previously been excluded by ISPRA from the calculation of municipal waste, as they were classified as special waste under the legislation in force. Under the decree, street-cleaning residues sent for recovery and the entire amount of multi-material collection, gross of rejects, are also accounted for within separate collection. Under the previous methodology, these flows were instead accounted for as mixed waste, contributing to total municipal waste generation (MW) but not to separate collection (SC).
The information base consists of ISPRA processing of data communicated by ARPA/APPA, Regions, Provinces, Provincial Waste Observatories and the annual databases of the Single Environmental Declaration Form (MUD). In particular, data are collected and processed at municipal level, except where they are available only in aggregated form by Territorial Area, Mountain Community, Consortium or Union of Municipalities.
For municipalities not covered by any information source, mixed municipal waste generation is estimated using a standardised methodology involving:
- classification of the municipalities in each province by resident population class (<5,000 inhabitants; 5,000-14,999; 15,000-29,999; 30,000-49,999; 50,000-149,999; ≥150,000) and determination of the average per capita municipal waste generation value for each class;
- quantification of total municipal waste generation for municipalities not covered by information by multiplying the average per capita generation value of the relevant class by the resident population of the municipality;
- quantification of the amount of mixed municipal waste as the difference between the total municipal waste generation of the municipality (MW) and the separate collection data for the same municipality. For separate collection, where information is not available, data for the same municipality referring to the previous year are used.
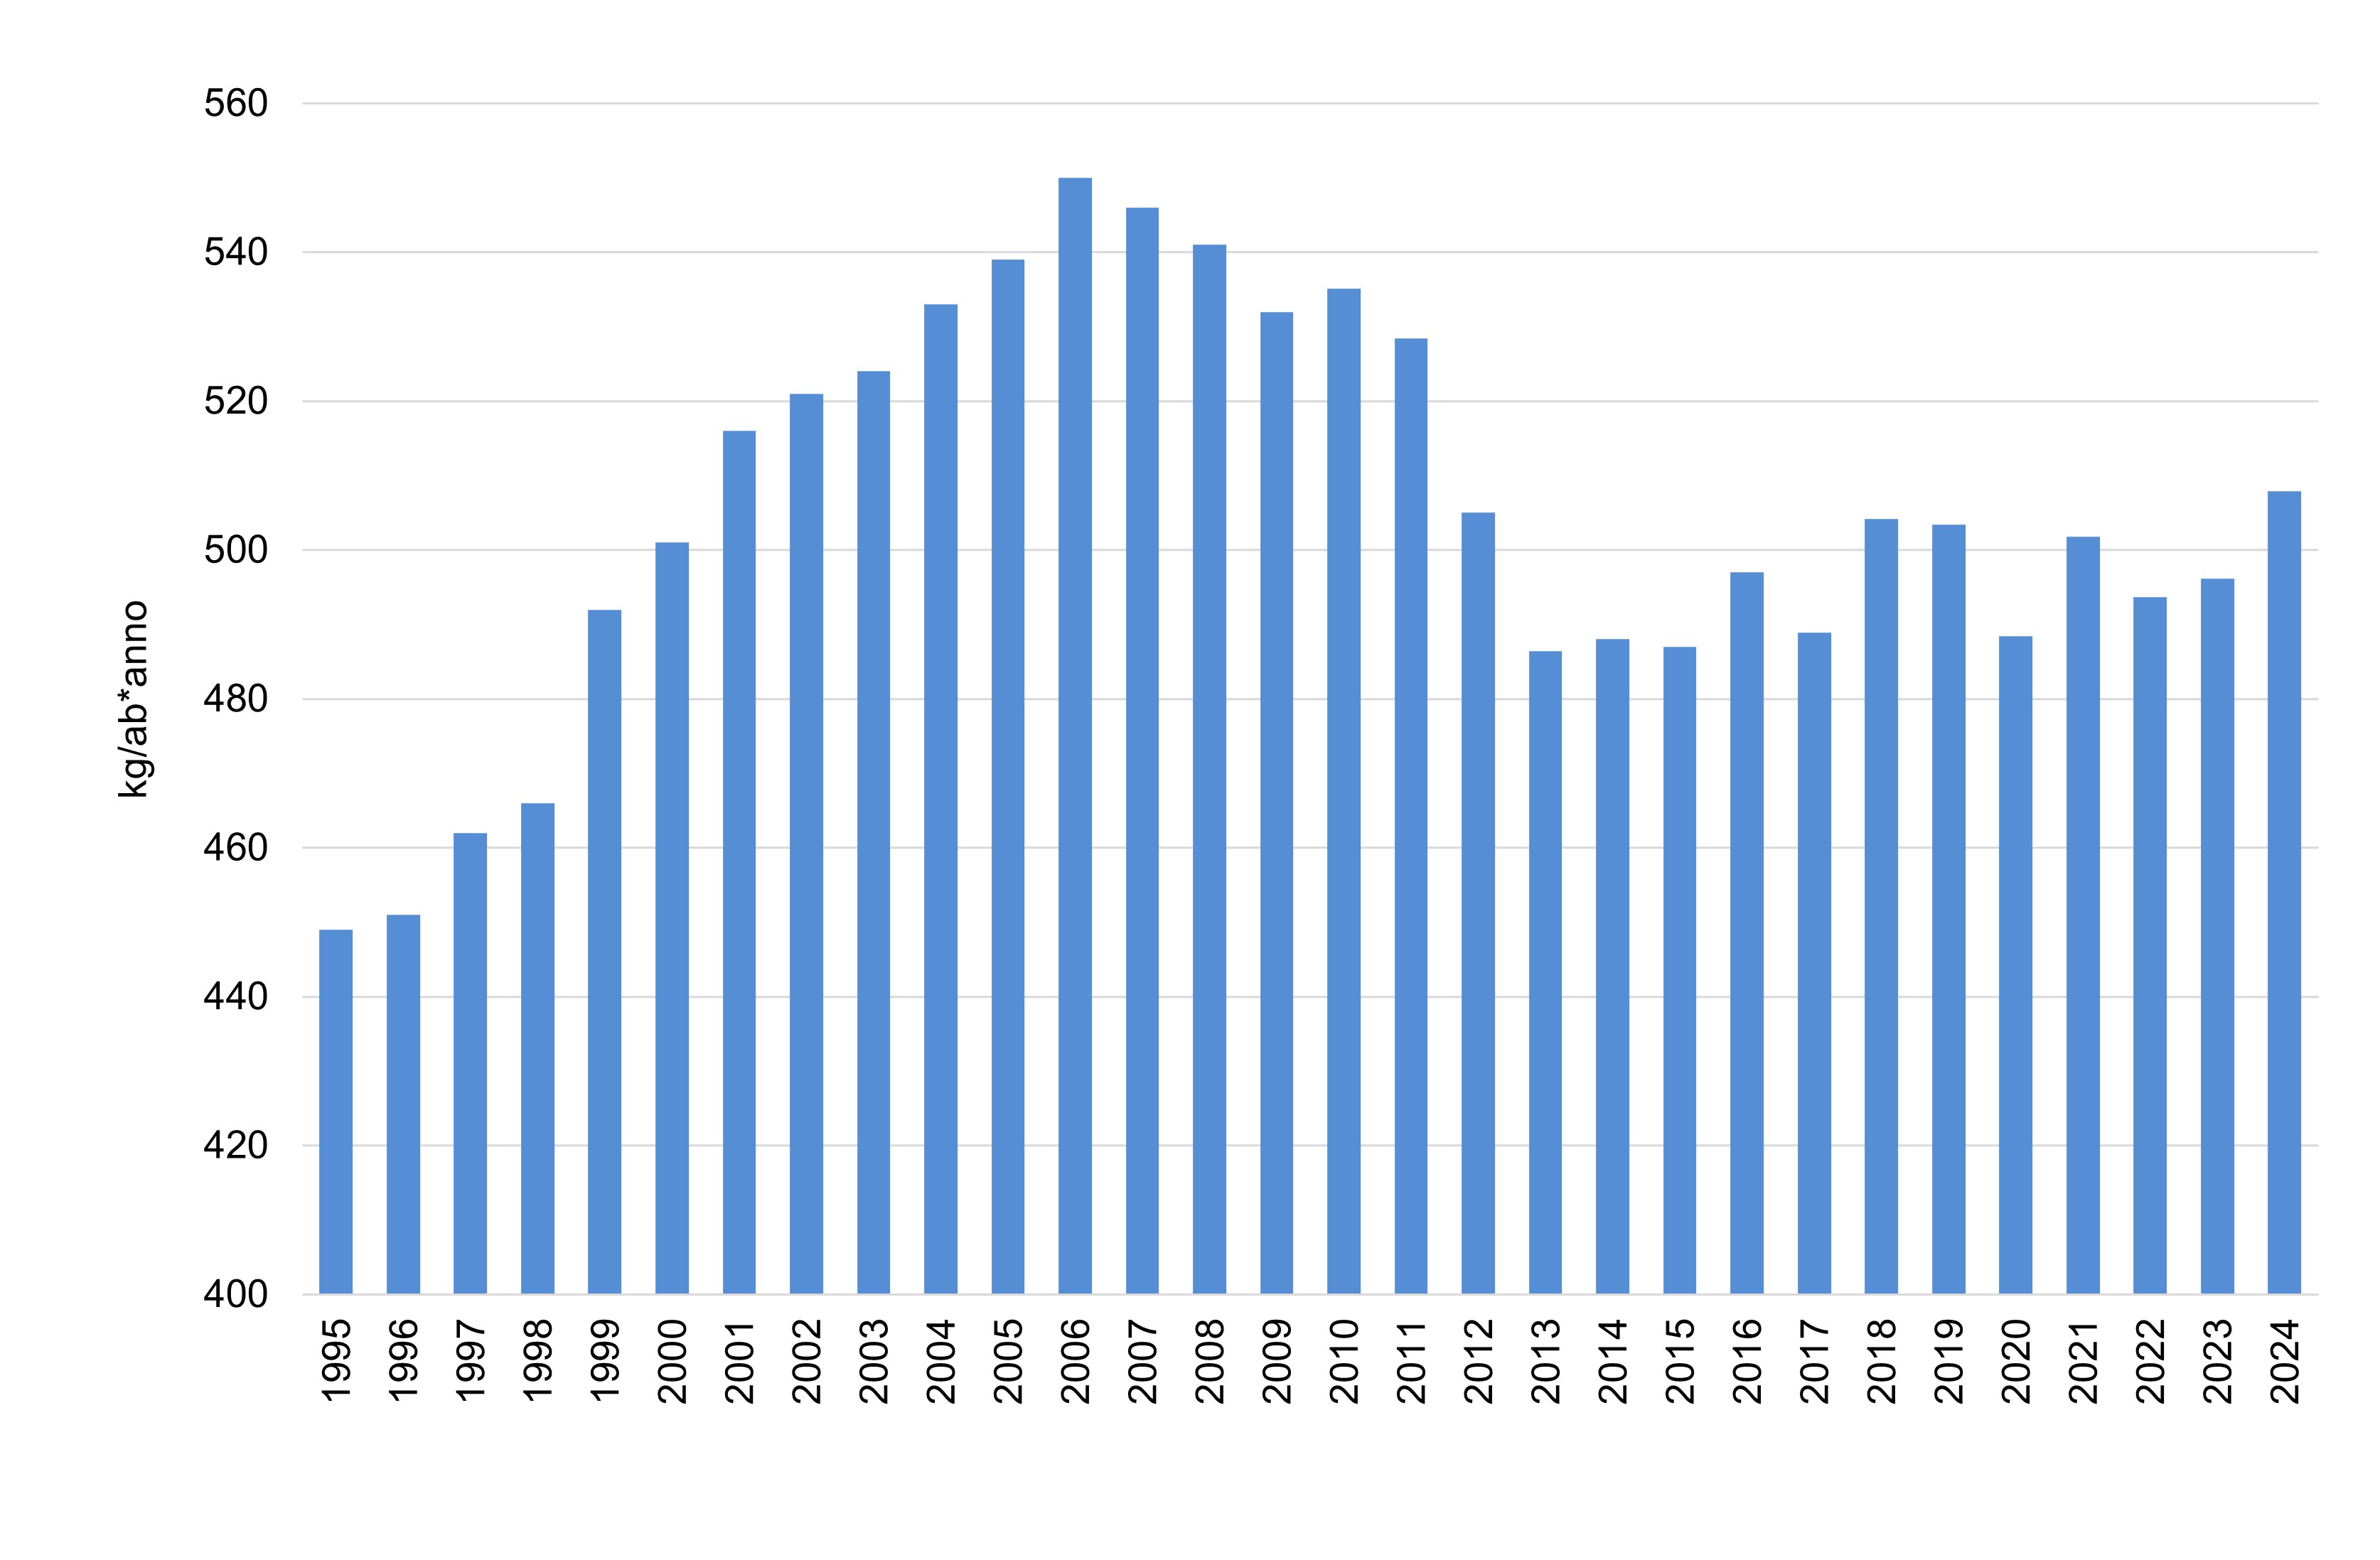
In 2024, municipal waste generation increased by 2.3% compared with 2023, corresponding to approximately 664 thousand tonnes. Per capita generation also increased, reaching 508 kg per inhabitant (+2.4% compared with the previous year).
Despite the observed increase, the national per capita value remains below the European Union average, equal to 517 kg per inhabitant in 2024. In light of this comparison, the status of the indicator can be considered moderate.
Looking at the long-term trend, between 2007 and 2010 municipal waste generation remained consistently above 32 million tonnes. Following the sharp decline recorded in 2011-2012, which coincided with the contraction in gross domestic product and household consumption, generation remained below 30 million tonnes until 2015.
Subsequently, with the exception of 2017, generation values rose again above 30.1 million tonnes, before starting to decrease, moderately in 2019 and more significantly in 2020. In 2021, a reversal of the trend was observed, in line with the post-pandemic economic recovery, although generation remained below 30 million tonnes.
Finally, after the contraction recorded in 2022, generation increased again over the two-year period 2023-2024. Overall, the trend can be considered broadly stable (Table 1).
| Allegati |
|---|
Titolo
Table 1: Total and per capita municipal waste generation Fonte
ISPRA Legenda
The population used to calculate the per capita value is the resident population as at 31 December of each year. |
Thumbnail
Titolo
Figure 1: Per capita quantity of municipal waste generated Fonte
ISPRA processing based on ISPRA and Istat data. |
Thumbnail
Titolo
Figure 2: Per capita quantity of municipal waste generated by region Fonte
ISPRA processing based on ISPRA and Istat data. |
In 2024, all northern regions recorded an increase in waste generation. More specifically, the largest percentage increases were observed in Veneto (+5.5%), Valle d’Aosta (+4.5%), Emilia-Romagna (+3.9%) and Piedmont (+3.8%).
In the central regions, with the exception of Marche (-0.4%), waste generation also increased compared with 2023: the increase was 2.9% in Umbria, 1.8% in Lazio and 0.6% in Tuscany.
In the southern regions, waste generation increased, except in Basilicata (-0.8%) and Puglia (-0.2%). The largest increases were recorded in Sardinia (+2%), Calabria and Molise (+1.4%) and Campania (+1.2%) (Table 1).
With regard to per capita generation, from 2012 to 2023 the national figure remained below 500 kg per inhabitant per year, except in 2012, 2018, 2019 and 2021. In 2024, per capita generation stood at 508 kg per inhabitant, showing a 2.4% increase compared with 2023 (Figure 1).
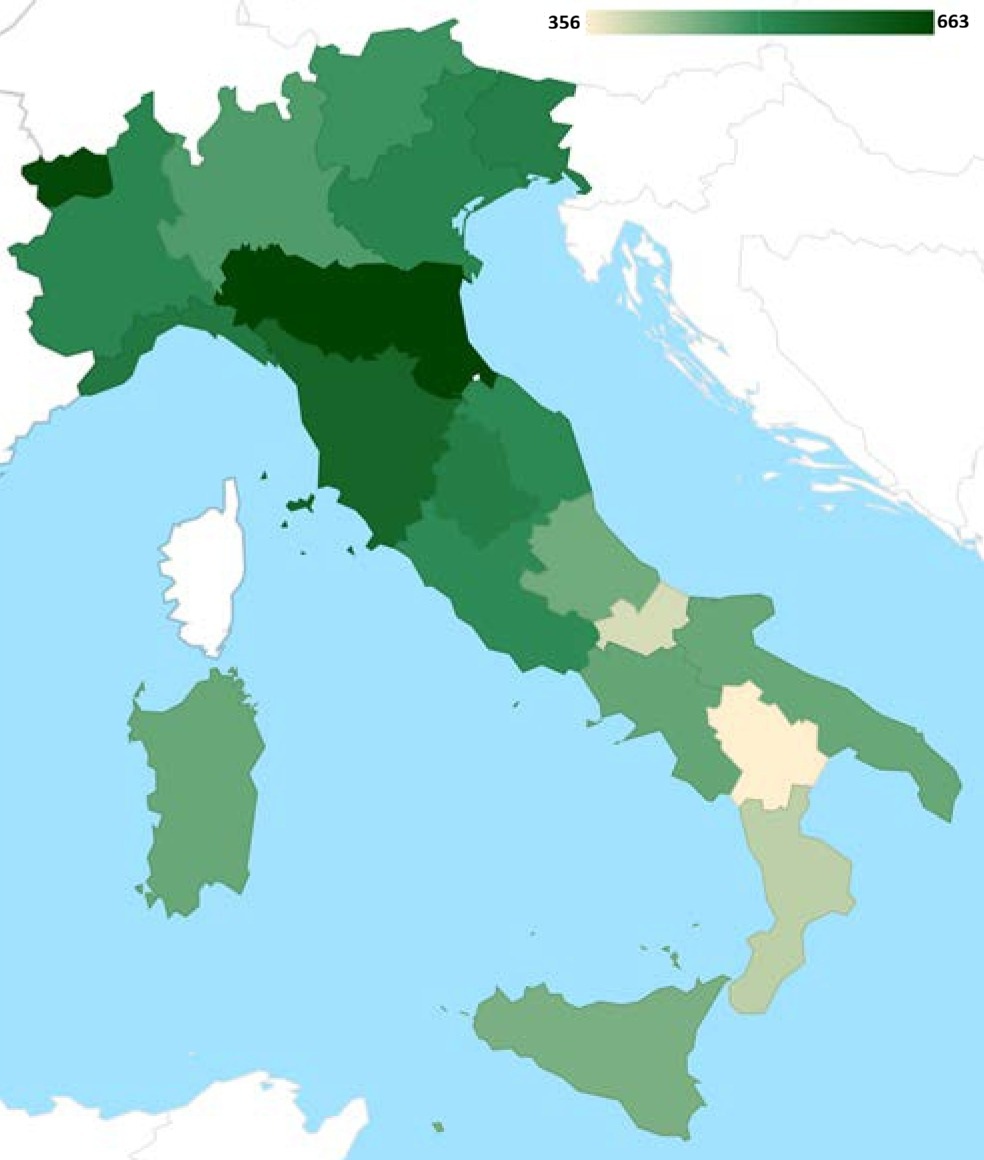
In 2024, as in previous years, the highest generation value was recorded in Emilia-Romagna, at 663 kg per inhabitant per year, increasing by more than 23 kg compared with 2023. This was followed by Valle d’Aosta, with 650 kg, up by 29 kg, and Tuscany, with 590 kg, up by 4 kg.
Overall, 10 regions recorded per capita values above the national average of 508 kg per inhabitant: in addition to the three mentioned above, these were Liguria, Umbria, Friuli-Venezia Giulia, Veneto, Piedmont, Marche and Lazio.
The lowest per capita generation values were recorded in Basilicata (356 kg per inhabitant), Molise (387 kg) and Calabria (405 kg) (Table 1, Figure 2).