Giovanni Finocchiaro, Silvia Iaccarino
Coastal tourism infrastructures, and in particular marinas, exert significant pressures on marine and coastal ecosystems. The indicator assesses the potential environmental pressure associated with marinas through the total number of berths and their density per kilometre of coastline at the regional level. Based on 2023 data, the total number of berths in Italy amounts to 161,778, with a national average density of 19.6 berths per km of coastline, showing an increase compared to 2022 and a strongly uneven territorial distribution.
Ports serve as key tourist attractions along the coast, enhancing the value of local tourism services and attracting specific types of tourists. However, the construction of marinas can harm coastal ecosystems and impact shoreline morphology.
The size of a marina, in terms of number of berths, serves as a key indicator of usage intensity. The greater the number of berths in a marina, the higher the potential for:
- Pollution from boat maintenance activities
- Environmental stress caused by recreational maritime activities
Studies have shown that antifouling paint residues are commonly found in marina sediments, posing a threat to the local marine environment.
This indicator presents, for coastal regions, the number of berths per kilometer of coastline.
To monitor the potential pressure exerted by marinas on local marine environments.
There are no mandatory compliance targets for this indicator. However, it falls within the broader regulatory framework of European and national policies on sustainable tourism, as well as EU regulations on marine-coastal ecosystems (e.g., Marine Strategy Framework Directive, Habitat Directive, and national/local spatial planning regulations).
Anthony, E. J. (1997): The status of beaches and shoreline development options on the French Riviera: a perspective and a prognosis. Journal of Coastal Conservation 3: 169-178.
Cassi, R., Tolosa, I. & De Mora, S. (2008): A survey of antifoulants in sediments from Ports and Marinas along the French Mediterranean coast. Marine Pollution Bulletin 56 (11): 1943-1948.
Konstantinou, I. K. & Albanis, T. A. (2004): Worldwide occurrence and effects of antifouling paint booster biocides in the aquatic environment: a review. Environment International 30: 235-248.
Martínez, K., Ferrer, I., Hernando, M. D., Fernández-Alba, A. R., Marcé, R. M., Borrull, F. & Barceló. D. (2001): Occurrence of Antifouling Biocides in the Spanish Mediterranean Marine Environment. Environmental Technology 22 (5): 543-552.
ISPRA
MIT (Ministry of Infrastructure and Transport)
Coastal regions
2010-2023
- Number of berths per region.
- Types of structures.
- Length-based classification.
- Percentage distribution per kilometer of coastline.
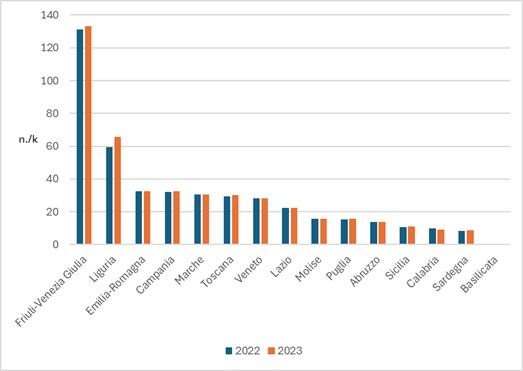
In 2023, Italy has a total of 161,778 berths, with an average density of 19.6 berths per kilometre of coastline. The regional picture highlights strong differences: Friuli-Venezia Giulia shows density values exceeding 130 berths per km of coastline, while Liguria, with 24,853 berths, records a density of 65.7 berths per km. By contrast, Sardinia (8.5 berths/km), Calabria (9.2 berths/km), and Sicily (11.1 berths/km) register significantly lower levels. Overall, the status is assessed as poor, in relation to the high infrastructural concentration in specific coastal areas and the associated potential environmental impacts (Table 1).
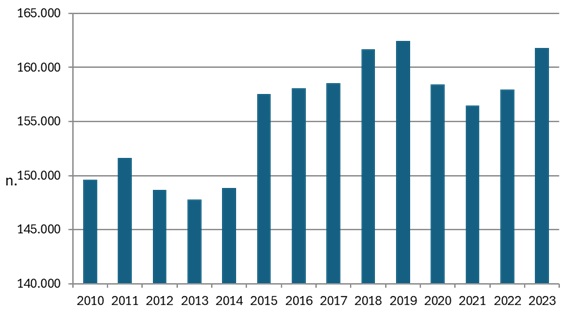
Over the period 2010–2023, the number of berths in Italy shows an overall increasing trend, indicating a progressive strengthening of infrastructural endowment supporting recreational boating and coastal tourism. This dynamic reflects, on the one hand, a growing demand for tourism and recreational services linked to the sea, with potential positive effects in economic and employment terms at the local level.
From an environmental perspective, however, the structural increase in berths entails a rise in potential pressure on coastal ecosystems, particularly in areas already characterized by high infrastructural density. Although the change observed in the 2022–2023 comparison is limited, it fits within a long-term trend that requires attention in terms of planning and sustainable management.
Overall, the trend is assessed as moderately negative from an environmental point of view, while acknowledging the role of marinas as a driver of economic development and tourist attractiveness of coastal areas (Figure 1).
| Allegati |
|---|
Titolo
Table 1: Number of berths by region, type of structure and length classes and percentage of distribution per km of coast (30/9/2023) Fonte
ISPRA processing on MIT and ISPRA data Note
The structures intended for pleasure boating can be classified based on art. 2 of the Presidential Decree. 2 December 1997 n.509, in three types: tourist port, tourist landing place and mooring point |
Thumbnail
Titolo
Figure 1: Number of berths in Italy Source ISPRA processing on ISPRA and MIT data Fonte
ISPRA processing on ISPRA and MIT data |
Thumbnail
Titolo
Figure 2: Number of berths per kilometer of regional coast (2022-2023) Fonte
ISPRA processing on ISPRA and MIT data |
In 2023, the distribution of berths along the Italian coastline shows marked territorial unevenness, as illustrated in Figure 2, with a strong concentration of infrastructures in some northern and central regions and significantly lower values in island and southern regions. This configuration reflects different models of development of recreational boating and diverse geomorphological and settlement characteristics of the coastlines.
The spatial interpretation of the indicator highlights that potential environmental pressure is not evenly distributed, but is locally significant in areas with the highest density of marinas. These elements underline the importance of differentiated coastal planning policies, aimed at balancing tourism and economic development needs with the protection of marine and coastal ecosystems.