Marina Vitullo
The indicator describes the trend of national emissions of acidifying substances SOx, NOx and NH 3, both at a total and sectoral level, highlighting the decreasing trend from 1990 to 2024 (-73%). With reference to Directive 2016/2284 of the European Parliament and of the Council, concerning the reduction of national emissions of certain air pollutants, which defines the national emissions reduction commitments compared to 2005, applicable from 2020 to 2029 and starting from 2030, sulfur oxides have reached the reduction percentage set for 2020 as early as 2009; ammonia since 2008, while nitrogen oxides reach it in 2016.
The quantification of emissions occurs through appropriate estimation processes, according to the methodology indicated by the European Environment Agency (EMEP/EEA air pollutant emission inventory guidebook, 2019). Anthropogenic emissions of sulfur oxides (SOx) arise largely from the use of sulfur-containing fuels, while natural sources are mainly volcanoes. SOx are among the main agents of the atmospheric acidification process, with negative effects on ecosystems and materials. Nitrogen oxides (NOx) can be traced back to combustion processes that occur at high temperatures and the sources are mainly transport, heating systems, industrial combustion, agriculture, the production of electricity and heat. As for ammonia (NH 3), emissions derive almost entirely from agricultural activities (including livestock).
Evaluate the pressures of acidifying substances and their trend over the years in relation to national and international reduction objectives (Legislative Decree 171/04, Gothenburg Protocol and NEC Directive).
The 1999 Gothenburg Protocol to the 1979 Convention on Long-Range Transboundary Pollution, amended in 2012, is aimed at reducing acidification, eutrophication and ground-level ozone (the European Community adheres to the protocol with Council Decision 2003/507/EC). Directive (EU) 2015/2193 (implemented with Legislative Decree 183 of 2017) applies to medium combustion plants and establishes rules for the control of sulfur dioxide (SO 2), nitrogen oxides (NOx) and dust, in order to reduce emissions into the air and the potential risks to human health and the environment resulting from these emissions. The new NEC Directive 2016/2284 of the European Parliament and of the Council (implemented with Legislative Decree 81 of 2018), concerning the reduction of national emissions of certain air pollutants, defines the national emission reduction commitments compared to 2005, applicable from 2020 to 2029 and starting from 2030: for SOx respectively reduction commitments of 35% and 71%; for NOx, reduction commitments of 40% and 65% respectively; for NH3 reduction commitments of 5% and 16% respectively.
ISPRA, 2026. Italian Emission Inventory 1990-2023. Information Inventory Report 2026
Ministry for the environment and land protection, 2003. National program for the reduction of annual emissions of sulfur dioxide, nitrogen oxides, volatile organic compounds and ammonia, MATT, communication to the EC pursuant to Directive 2001/81/EC.
none
none
ISPRA (Higher Institute for Environmental Protection and Research)
Used ISPRA data from the National Inventory of Atmospheric Emissions (https://emissioni. sina. isprambiente. it/interno-nazionale/)
National
1990 - 2024
Estimates made as part of the preparation of the national inventory of atmospheric emissions. To evaluate the overall trend, conversion factors in acid equivalents (H+) are used. These factors are those used by the European Environment Agency. For air pollutants the methodology used is that indicated by the European Environment Agency (EMEP/EEA Guidebook 2023). For the description of the estimation methodology, please refer to the Information Inventory Report – IIR (https://www. isprambiente. gov. it/it/pubblicazioni/rapporti; https://www. ceip. at/status-of-reporting-and-review-results/2026-submission /)
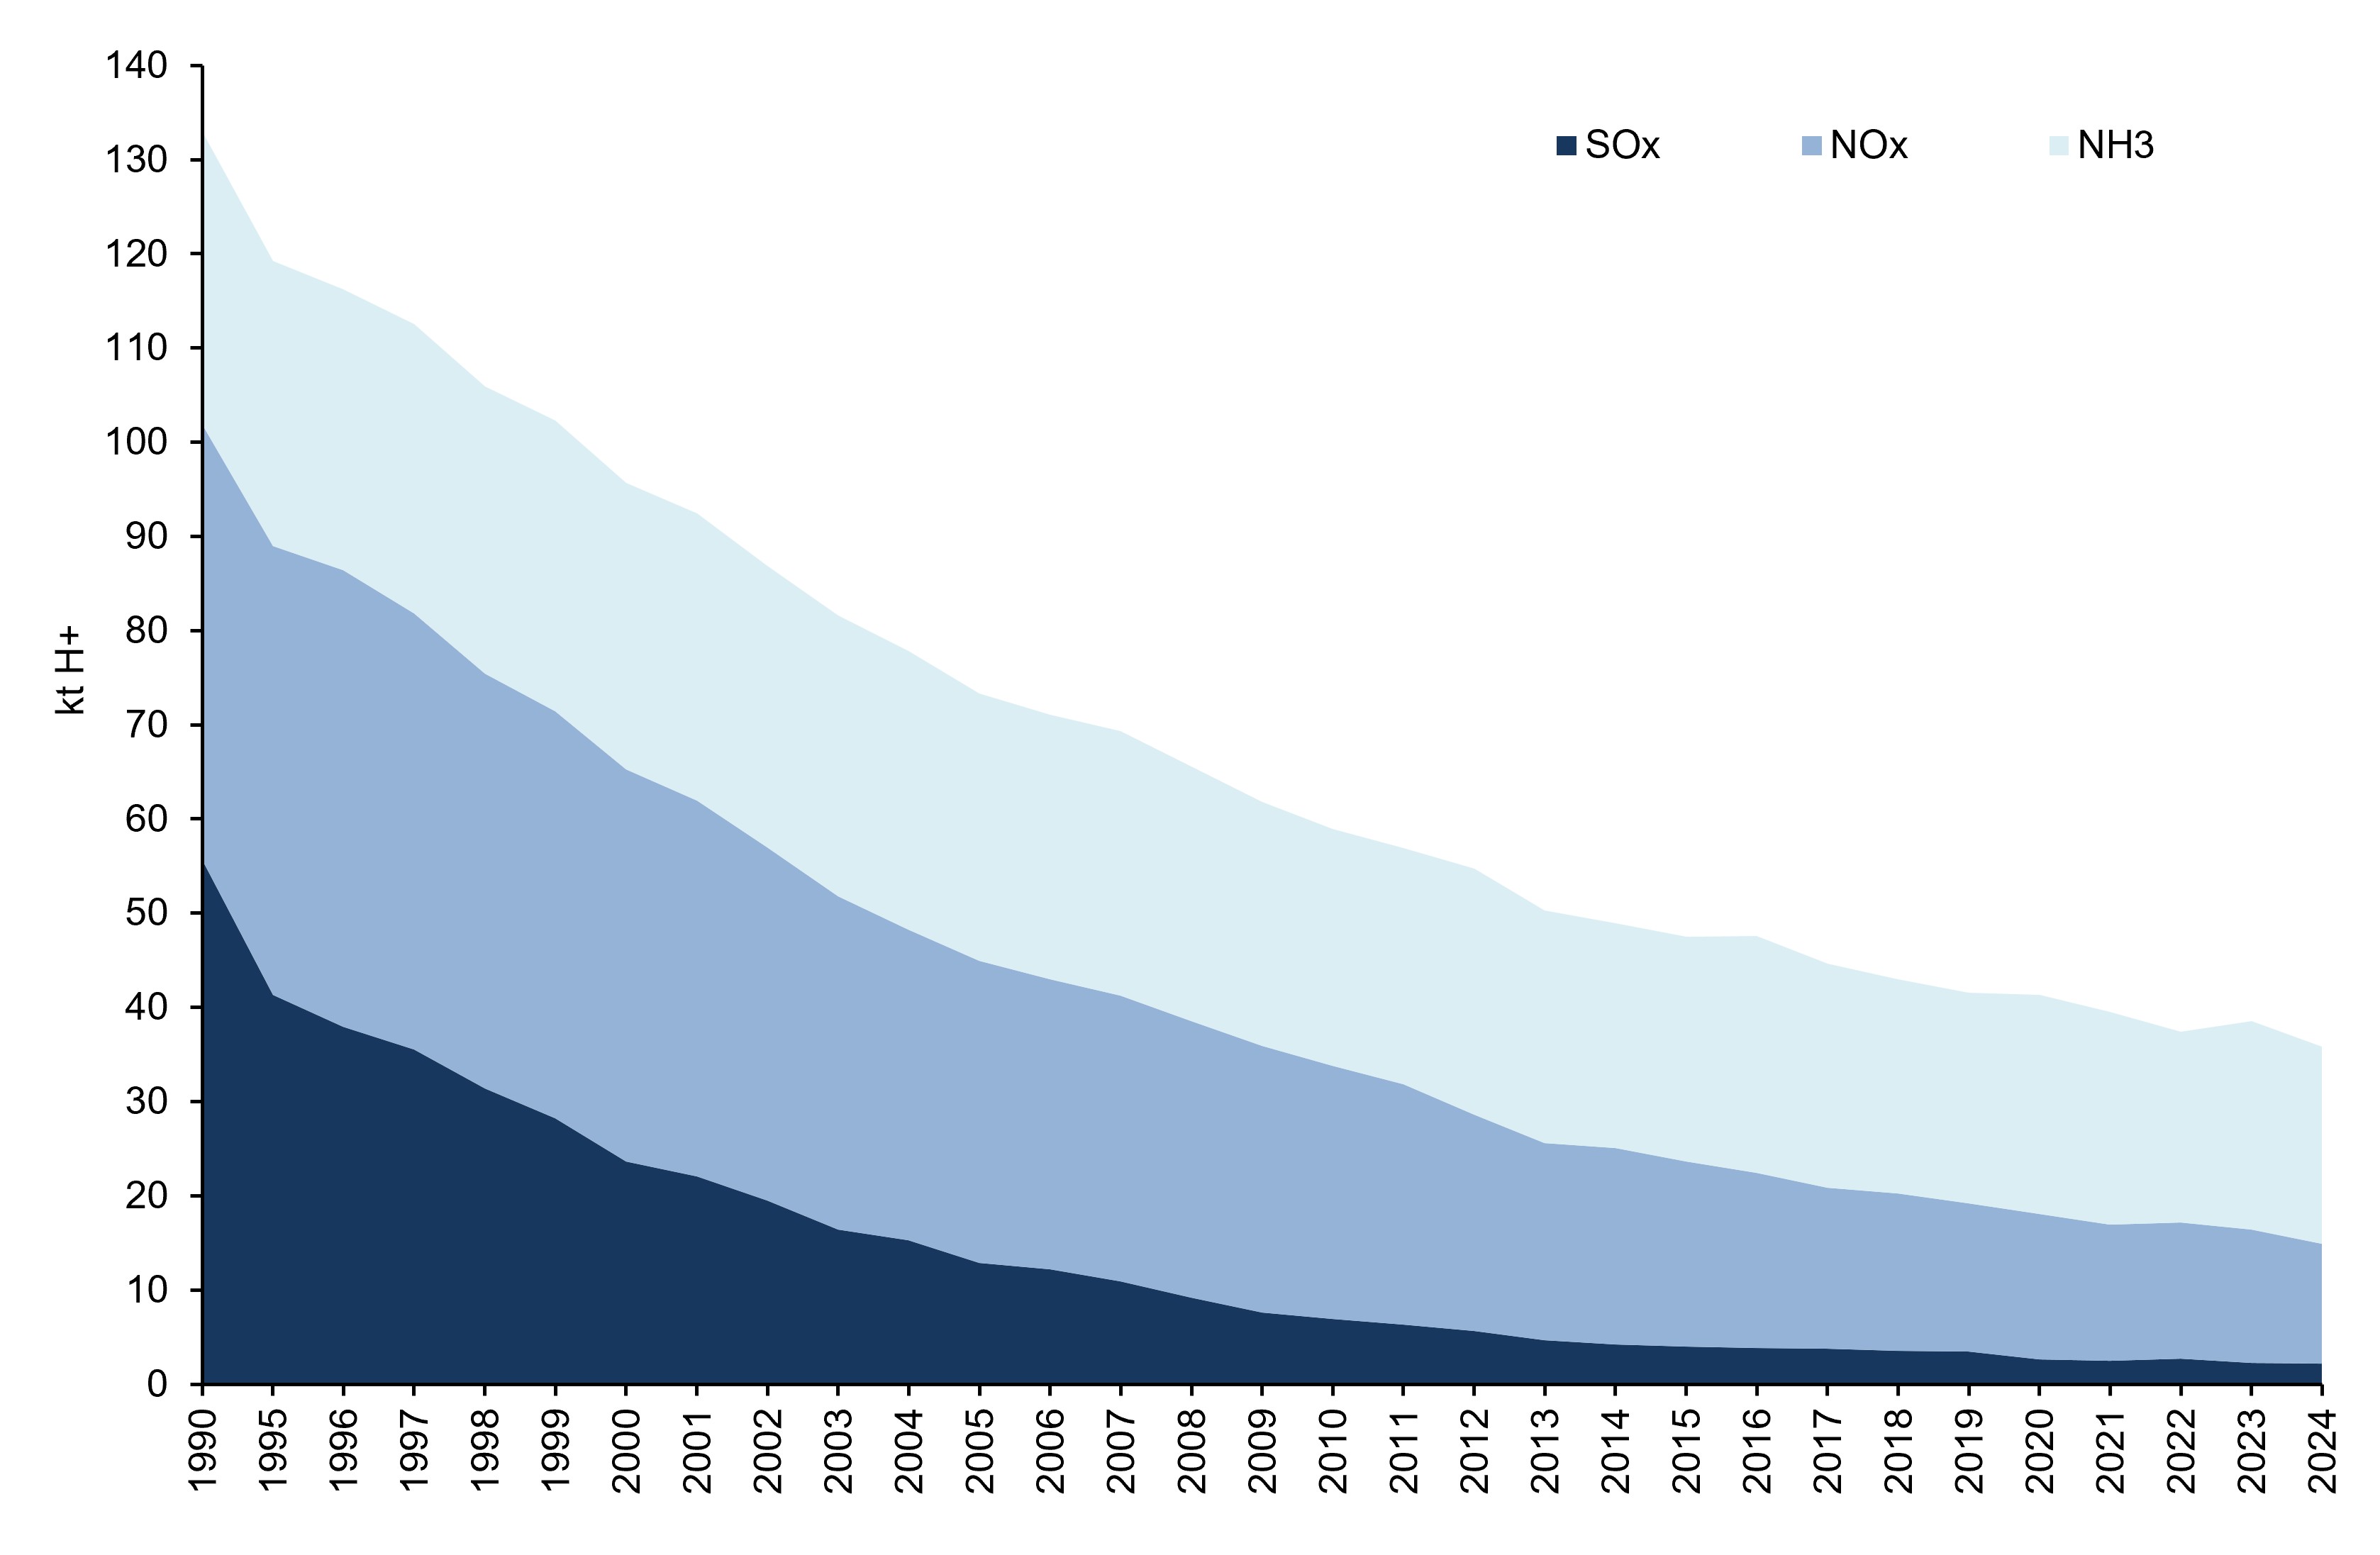
The emissions of the three acidifying substances in 2024 are equal to a total of 35.9 ktH+/a. In terms of tonnes, 70,129 of sulfur oxides, 584,377 of nitrogen oxides and 356,434 of ammonia (Tables 1 and 2, Figure 4). All three substances meet the reduction targets set for 2020.
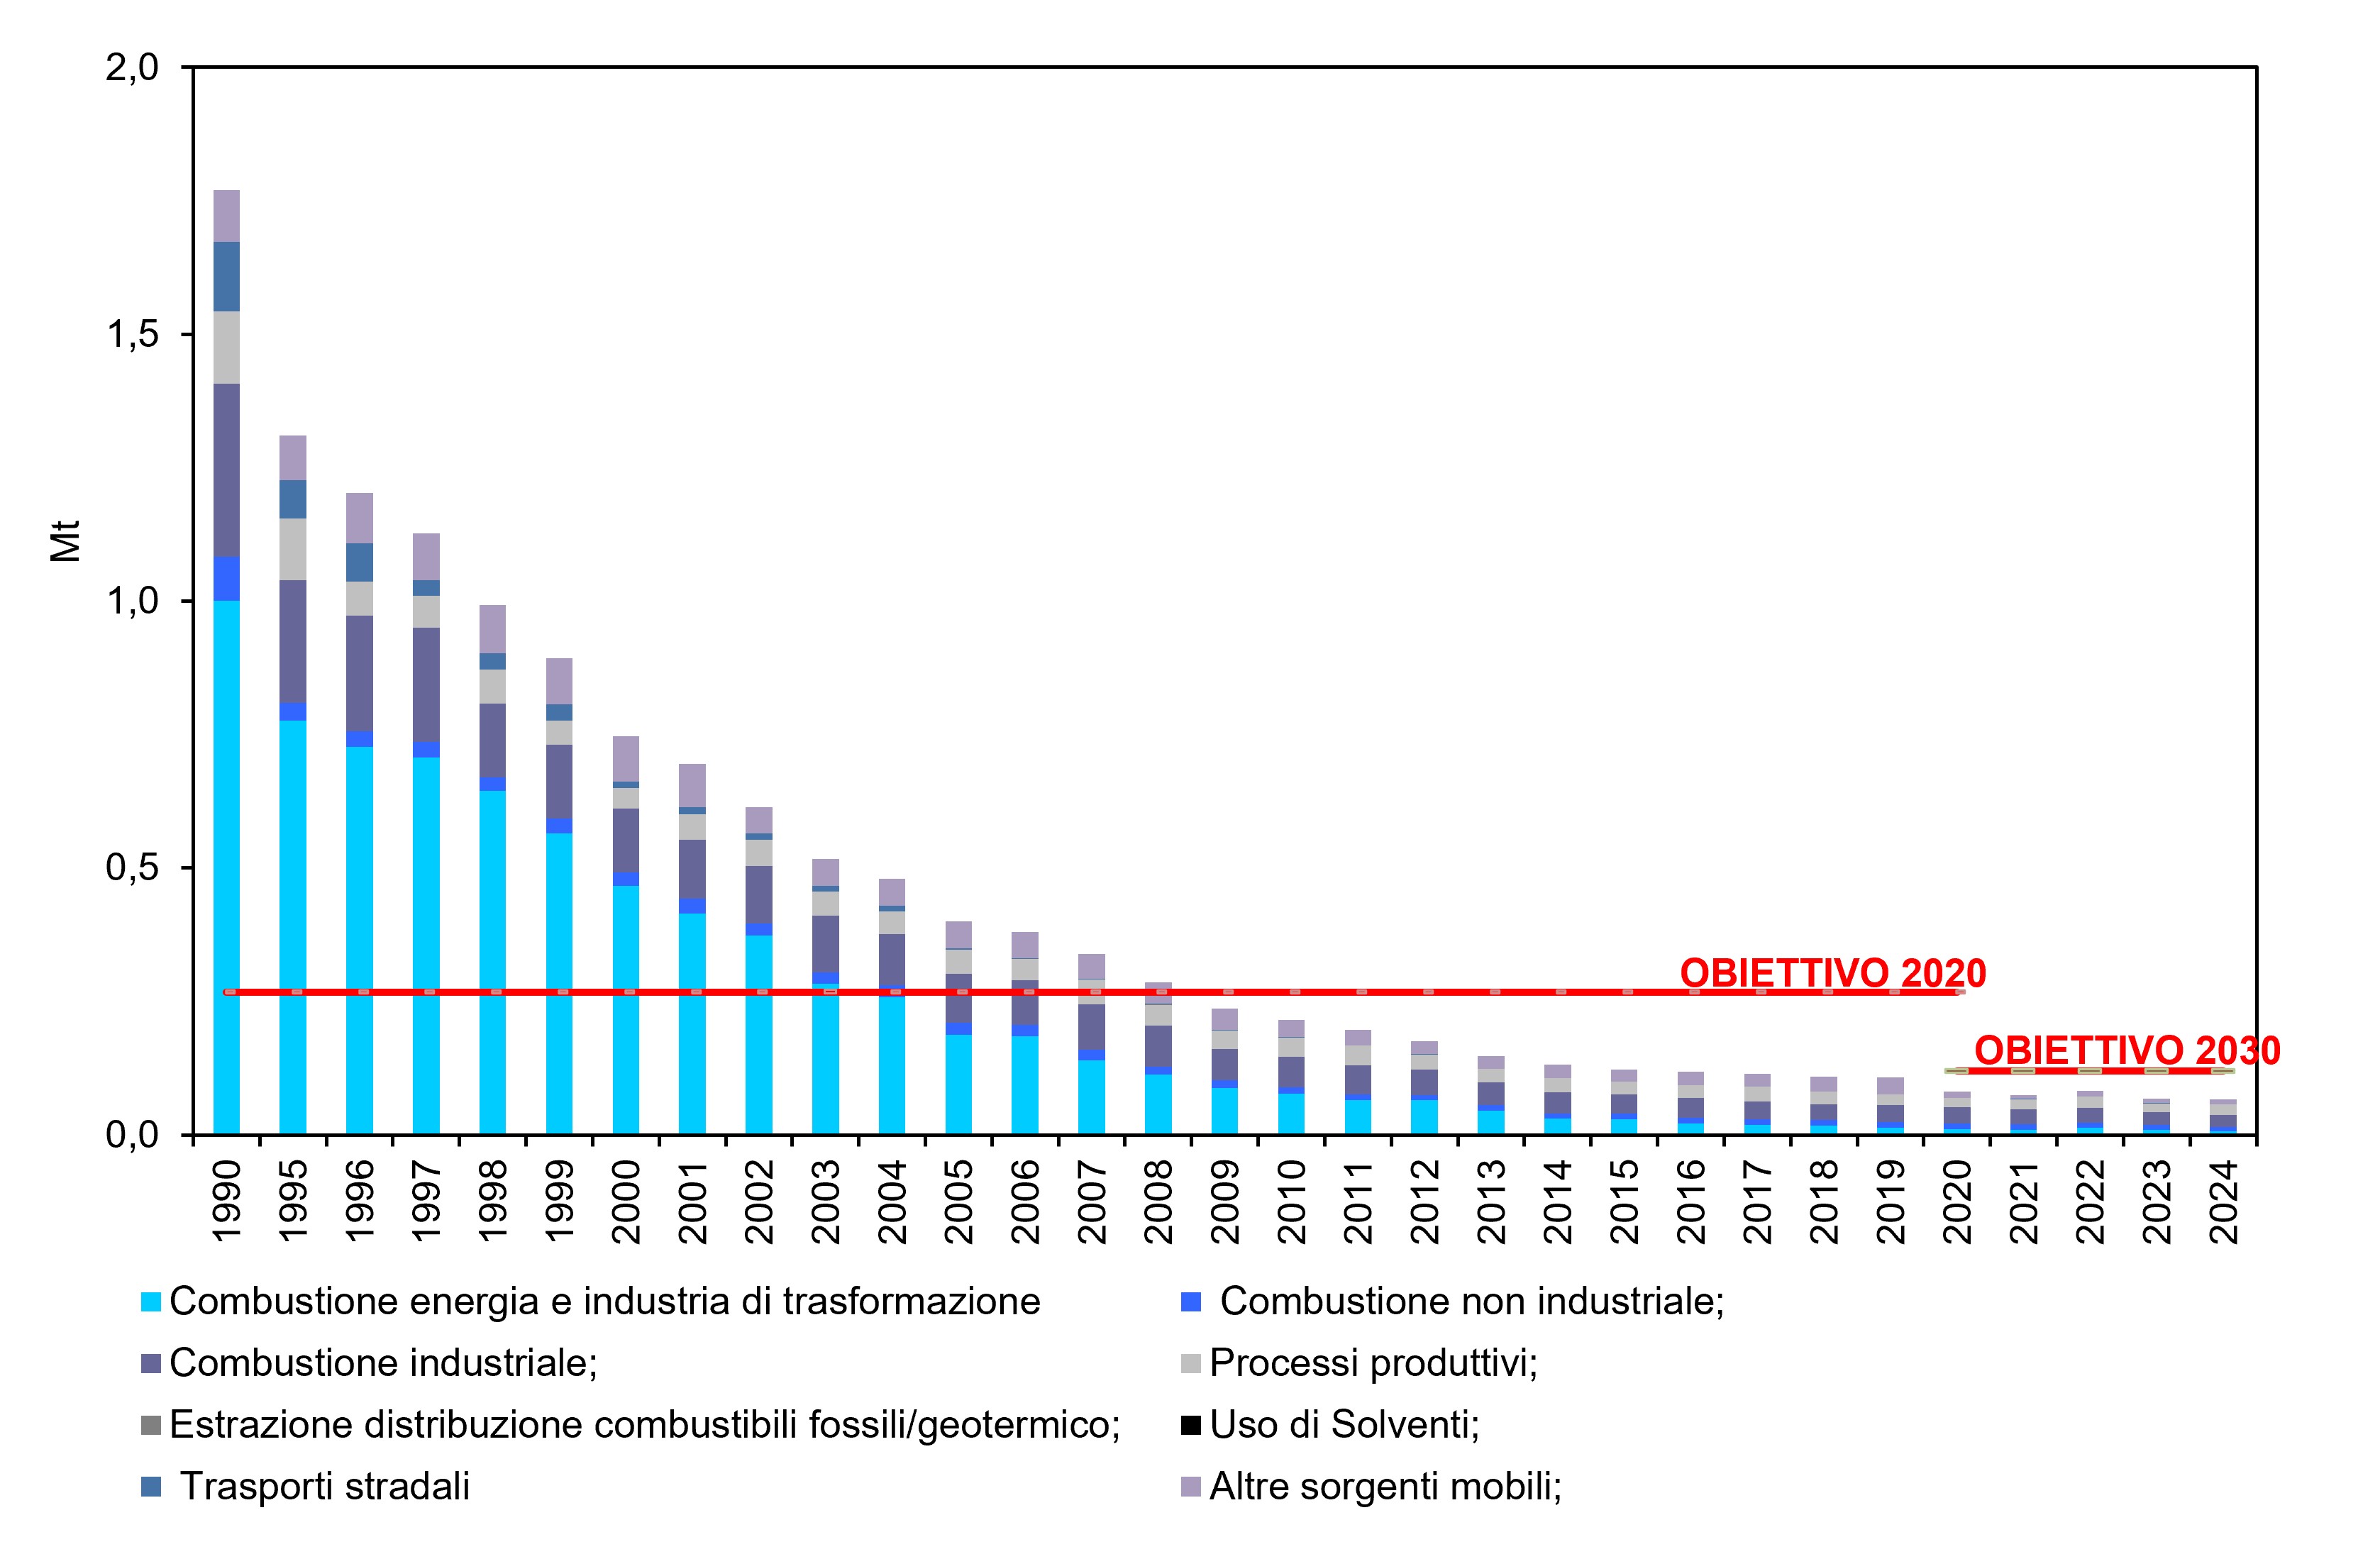
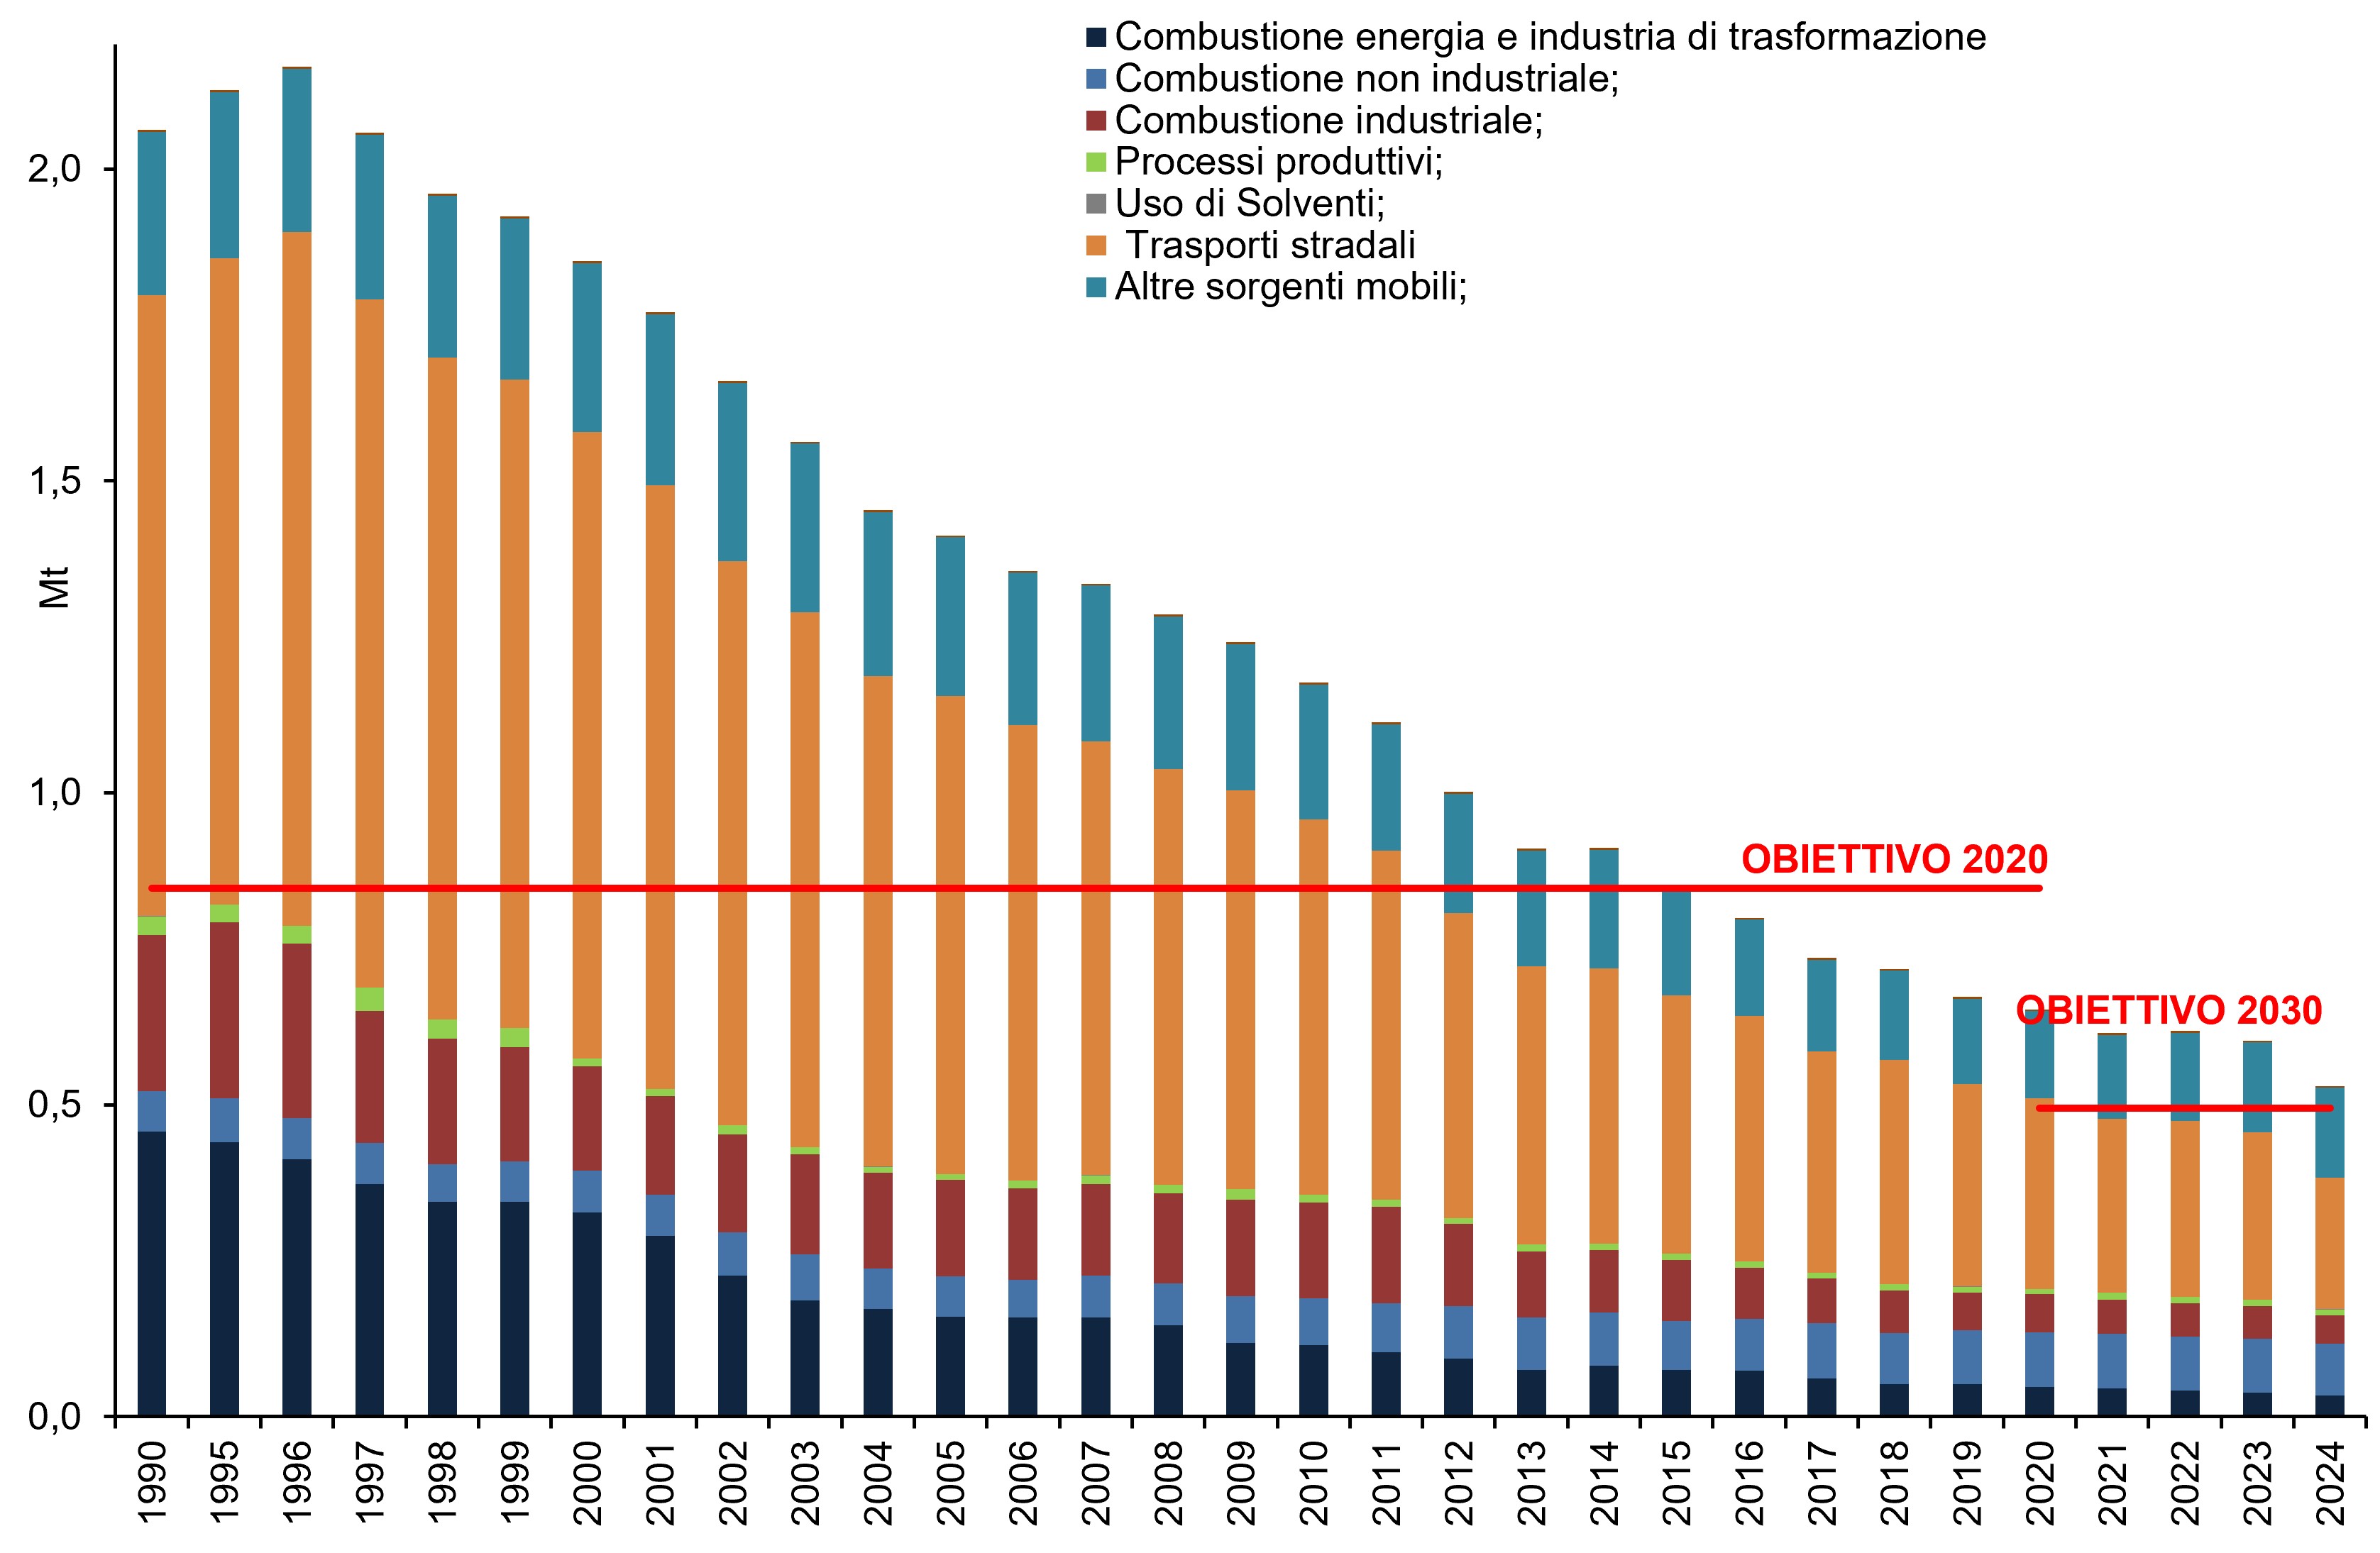
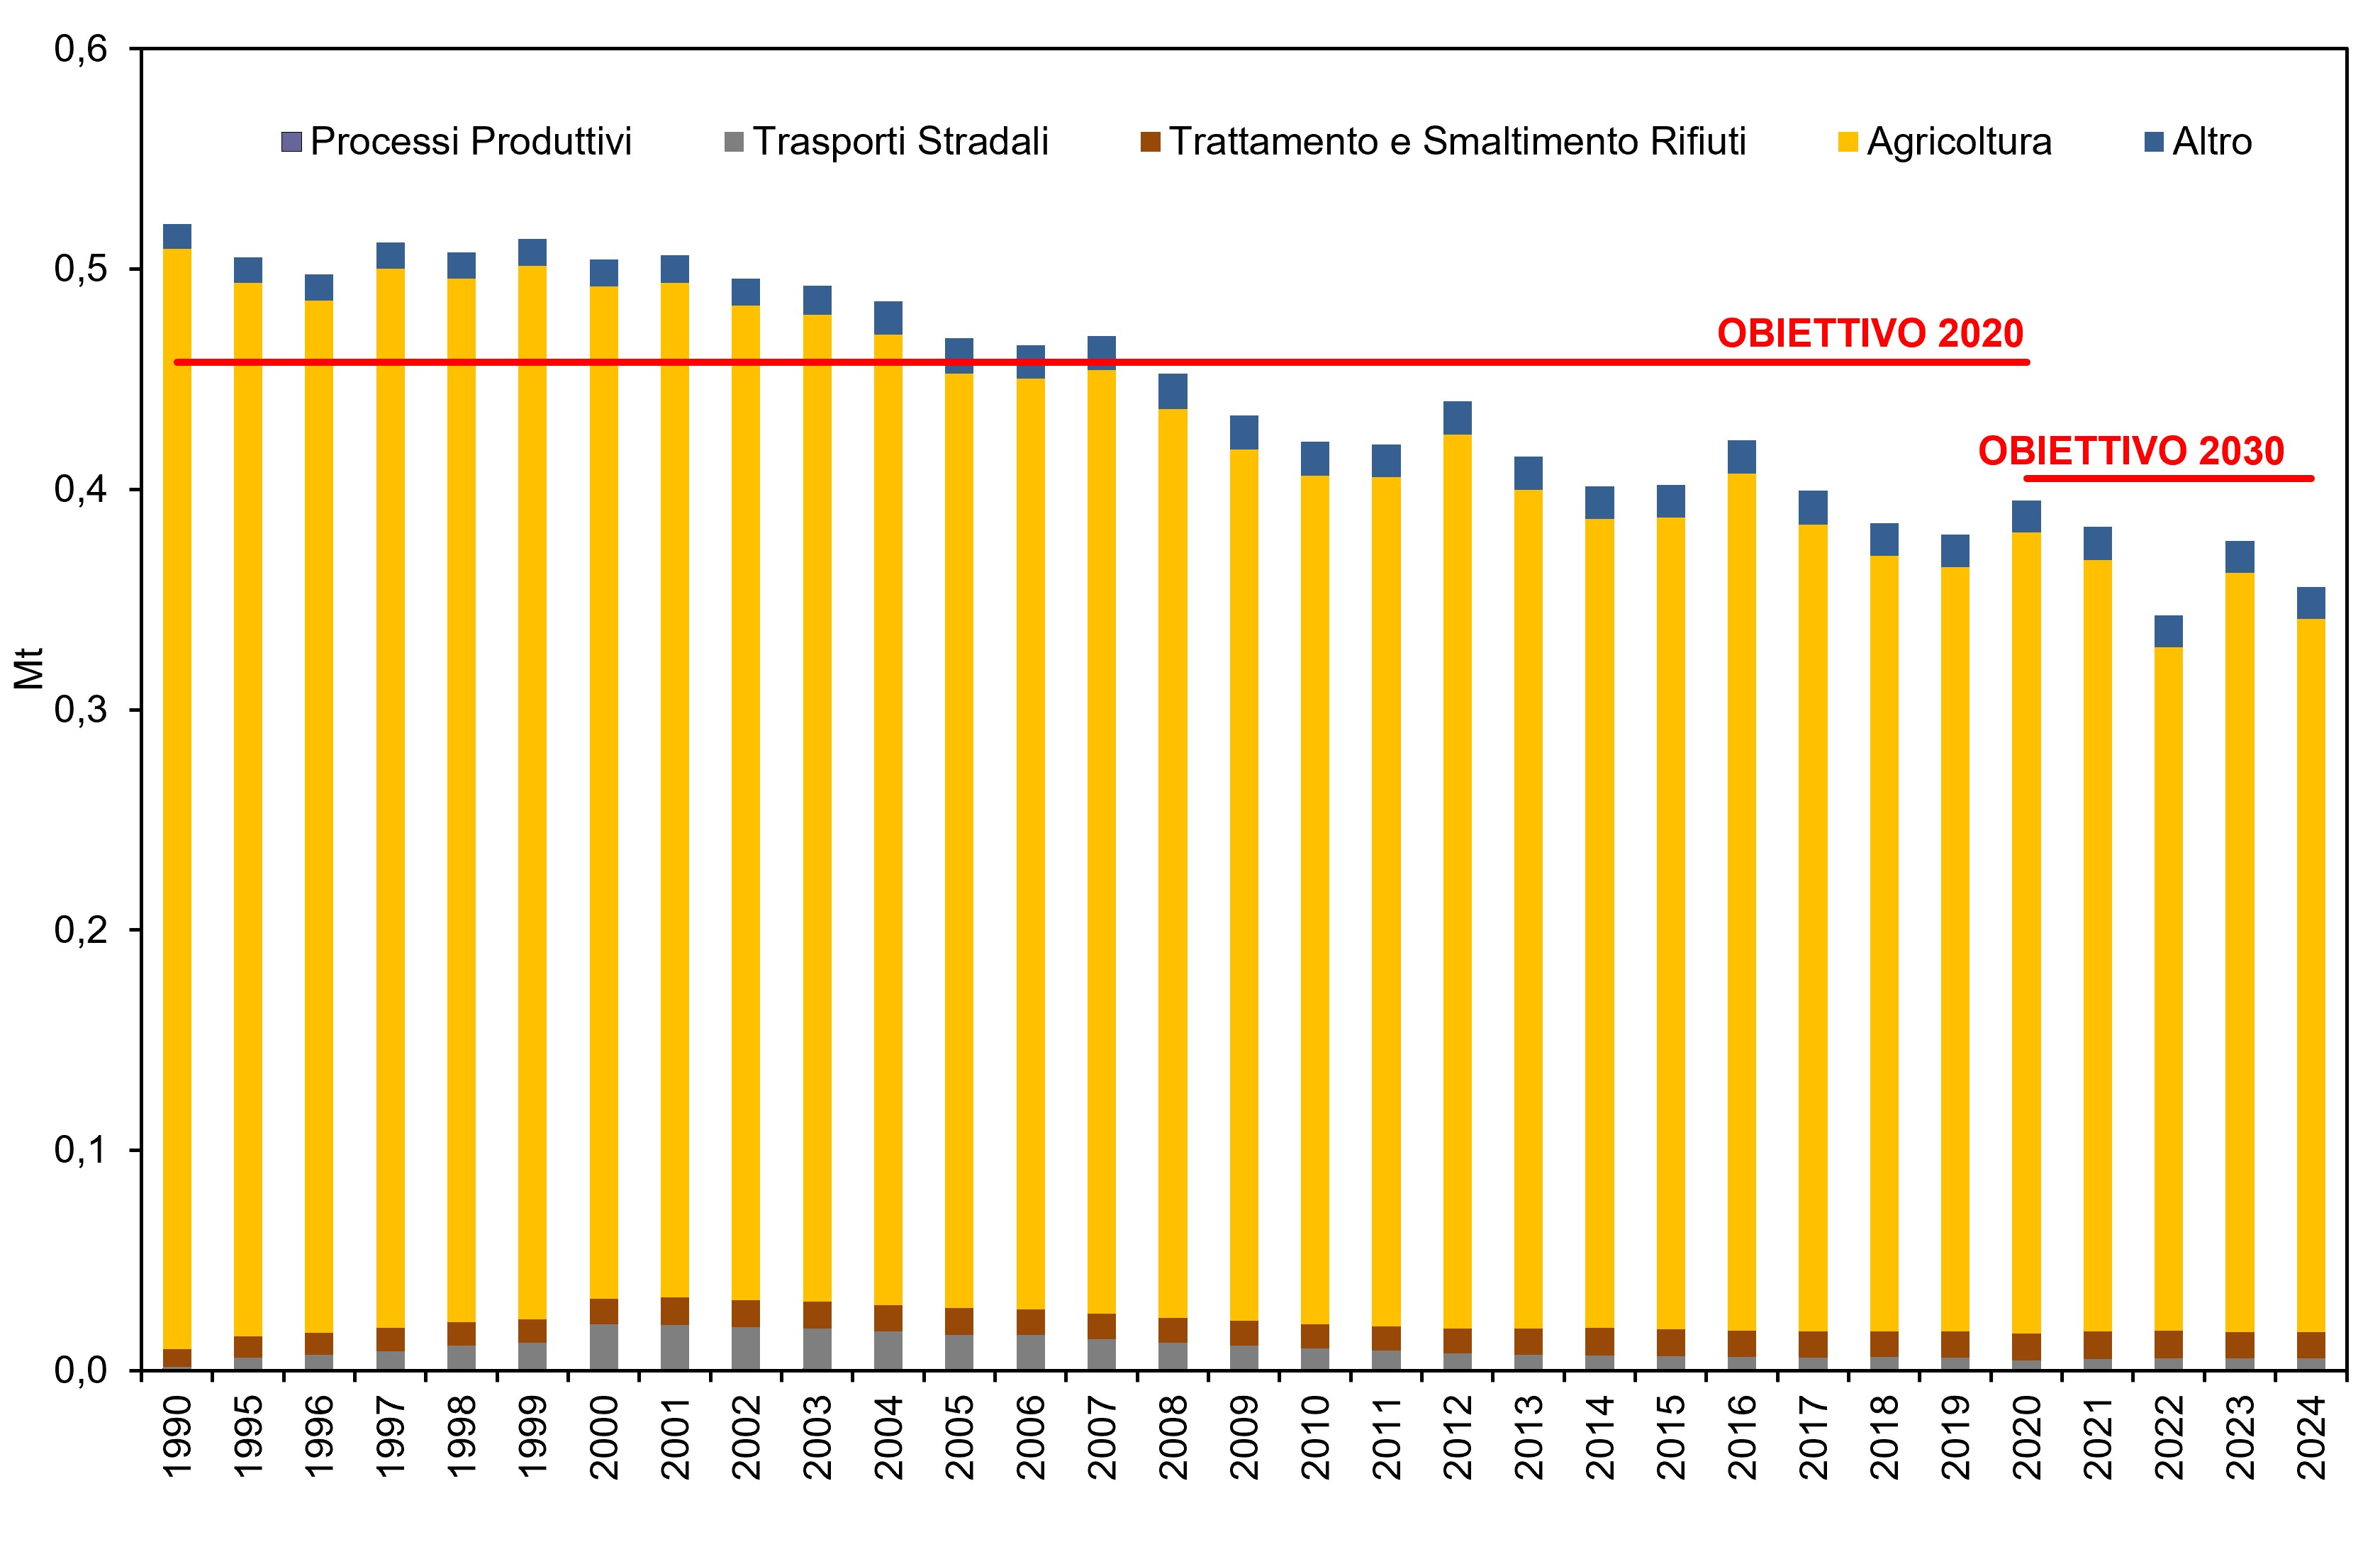
The emissions of the three acidifying substances expressed in acid equivalents are decreasing overall from 1990 to 2024 (-73%). In 2024 they are distributed as follows: sulfur oxides have a weight of 6.1%, a sharp reduction compared to 1990 (-96.1%); emissions of nitrogen oxides and ammonia account for 35.4% and 58.5% respectively, both decreasing (-72.5%, -32.6%) but with an increasing relative weight compared to 1990 (Table 2). In reference to the reduction commitments imposed by the legislation, sulfur oxides, already since 2009, with a decrease of 41% compared to 2005 (Figure 1), and ammonia, in 2008, with a decrease of 5% compared to 2005 (Figure 3), reach the reduction percentage imposed for 2020; while nitrogen oxides reached the reduction percentage set for 2020 in 2016, with a reduction of 42% (Table 1, Figure 2).
| Allegati |
|---|
Titolo
Table 1: Emissions of acidifying substances by sector Fonte
ISPRA Legenda
A – Energy and transformation industries combustion; B – Non-industrial combustion; C – Industrial combustion; D – Production processes; E – Extraction and distribution of fossil/geothermal fuels; F – Solvent use; G – Road transport; H – Other mobile sources; I – Waste treatment and disposal; L – Agriculture; M – Other (pets). Note
Emission values updated according to the annual update of the National Emission Inventory. |
Titolo
Table 2: Total national emissions of acidifying substances in acid equivalent Fonte
ISPRA Note
Emission values updated according to the annual update of the National Emission Inventory. Conversion factor to acid equivalents (H⁺/kg): SOx = 31.25; NOx = 21.74; NH₃ = 58.82. |
Titolo
dati figura 4 |
Thumbnail
Titolo
Figure 1: National Emissions of Sulfur Oxides by Sector Fonte
ISPRA Note
The emission values have been updated in line with the annual update of the national emissions inventory. |
Thumbnail
Titolo
Figure 2: National Emissions of Nitrogen Oxides by Sector Fonte
ISPRA Note
The emission values have been updated in line with the annual update of the national emissions inventory. |
Thumbnail
Titolo
Figure 3: National Emissions of Ammonia by Sector Fonte
ISPRA Note
The emission values have been updated in line with the annual update of the national emissions inventory. |
Thumbnail
Titolo
Figure 4: Total National Emissions of Acidifying Substances in Acid Equivalent Fonte
ISPRA Note
The emission values have been updated in line with the annual update of the national emissions inventory. Conversion factor to acid equivalents (H⁺/kg): SOx = 31.25; NOx = 21.74; NH₃ = 58.82. |
National emissions are calculated in accordance with the estimation methodology adopted at European level and reported in the EMEP/EEA air pollutant emission inventory guidebook 2023. To guarantee consistency and comparability of the inventory, the annual updating of emissions involves the continuous review of the entire historical series on the basis of greater information and the most recent methodological developments. Emissions from natural sources (other emission sources and absorptions) are not counted in the totals, in accordance with the classification adopted in the estimate of emissions in the inventory. From the analysis of the data it can be seen that emissions of sulfur oxides are reduced by 96% between 1990 and 2024, this reduction is mainly attributable to the constraints introduced on the sulfur content in fuels, which determine a sharp decrease in emissions at a general level, in particular the road transport sector recorded a drop of 99.7%, accounting for 0.6% of the total emitted at a national level in 2024 (Table 1, Figure 1). From 1990 to 2024, nitrogen oxide emissions will be reduced by 72.5%. The emission contribution of road transport in 2024 drops to 36% against an average of 48% over the entire period, overall these emissions are reduced by 78.9%. NOx emissions from modes of transport other than road transport, although decreasing by 44.8% since 1990, represent the second source of emissions at a national level, and will contribute to 24.7% of the total emissions in 2024. 14.2% of emissions come from non-industrial combustion, the only sector to show an increase (+29.2% since 1990), while 7.9% and 5.8% of the total emissions at national level in 2024 come from industrial combustion and combustion in the energy production and processing industry sectors respectively. The agriculture sector has a weight of 9.3% and has shown a reduction of 11.6% since 1990 (Table 1, Figure 2). Ammonia emissions from 1990 to 2024 decrease by 32.6%. Over the entire period, the main person responsible for NH3 emissions is the agricultural sector, which contributes 90.8% of total emissions and which, therefore, determines their trend over the years (a reduction of -35.2% is found). Emissions from road transport, despite showing a marked growth, then attenuated by the decrease recorded starting from 2001, represent in 2024 only 1.6% of the total emitted at national level. Emissions from waste treatment and disposal from 1990 to 2024 increased by 48%, but in 2024 reached a weight of 3.4% on the total emitted at a national level (Table 1, Figure 3).