Angela Cimini, Luca Congedo, Paolo De Fioravante, Ines Marinosci, Stefano Pranzo
Land fragmentation is the process that leads to a progressive reduction in the surface area of natural and semi-natural environments and to an increase in their isolation. This process, which transforms large territorial patches into smaller and more isolated units, is mainly driven by urban expansion—implemented through more or less sustainable development patterns—and by the growth of infrastructure networks aimed at improving connectivity between urbanized areas through linear works. In 2024, 42.41% of the national territory was classified as having high or very high fragmentation. The regions with the largest share of very highly fragmented land are Veneto (39.73%), Lombardy (33.73%), Emilia-Romagna (25.22%), Puglia (25.22%), and Campania (25.76%). These figures confirm the close relationship between fragmentation and urbanization density.
Land fragmentation is the process by which the continuity of ecosystems, habitats, and landscape units is reduced as a result of phenomena such as urban expansion and the development of infrastructure networks. These processes transform large territorial patches—defined as unsealed areas lacking significant artificial elements that disrupt continuity—into smaller and more isolated patches.
The degree of land fragmentation is assessed using the effective mesh density index (Seff), which measures the barrier to movement caused by so-called “fragmenting elements” present in the landscape. The index represents the density of territorial patches (number of meshes per 1,000 km²), calculated according to the effective mesh size (meff) methodology (Jaeger, 2000). This approach is related to the probability that two randomly selected points within a given area fall within the same patch. The methodology has been suitably modified using the cross-boundary connections procedure (CBC), which ensures territorial continuity beyond the boundaries of the reporting unit (1 km² grid cell).
To assess the degree of land fragmentation caused by the presence of artificial land cover, which leads to reduced continuity of ecosystems, habitats, and landscape units.
Achieving the priority objectives of the 8th Environment Action Programme (8th EAP) requires making full use of ecosystem-based approaches and green infrastructure, ensuring biodiversity restoration and strengthening ecosystem integrity and connectivity.
The National Sustainable Development Strategy identifies among its strategic objectives the need to “ensure ecosystem restoration and defragmentation and to promote urban–rural ecological connections” (Planet area, Objective III.4).
Jaeger J. A. G., (2000) Landscape division, splitting index, and effective mesh size: new measures of landscape fragmentation. Landscape Ecology 15: 115–130.
Moser B., Jaeger J. A. G., Tasser E., Eiselt B., Tappeiner U. (2007). Modification of the effective mesh size for measuring landscape fragmentation to solve the boundary problem. Landscape Ecology 22: 447–459.
ISPRA-SNPA national map of land consumption.
-
In the future, the index could be implemented using reporting units other than 1 km² grid cells, for example by referring to selected land-cover classes (e.g., ecosystem units).
SNPA (National System for Environmental Protection)
National, Regional (20/20)
2006, 2012, 2024
Effective mesh density was calculated at the national level using a regular grid of 1 km² cells as reporting units. Artificial land cover, derived from the ISPRA-SNPA National Land Take Map and appropriately processed to improve the identification of linear infrastructures (roads and railways), was considered as the set of fragmenting elements.
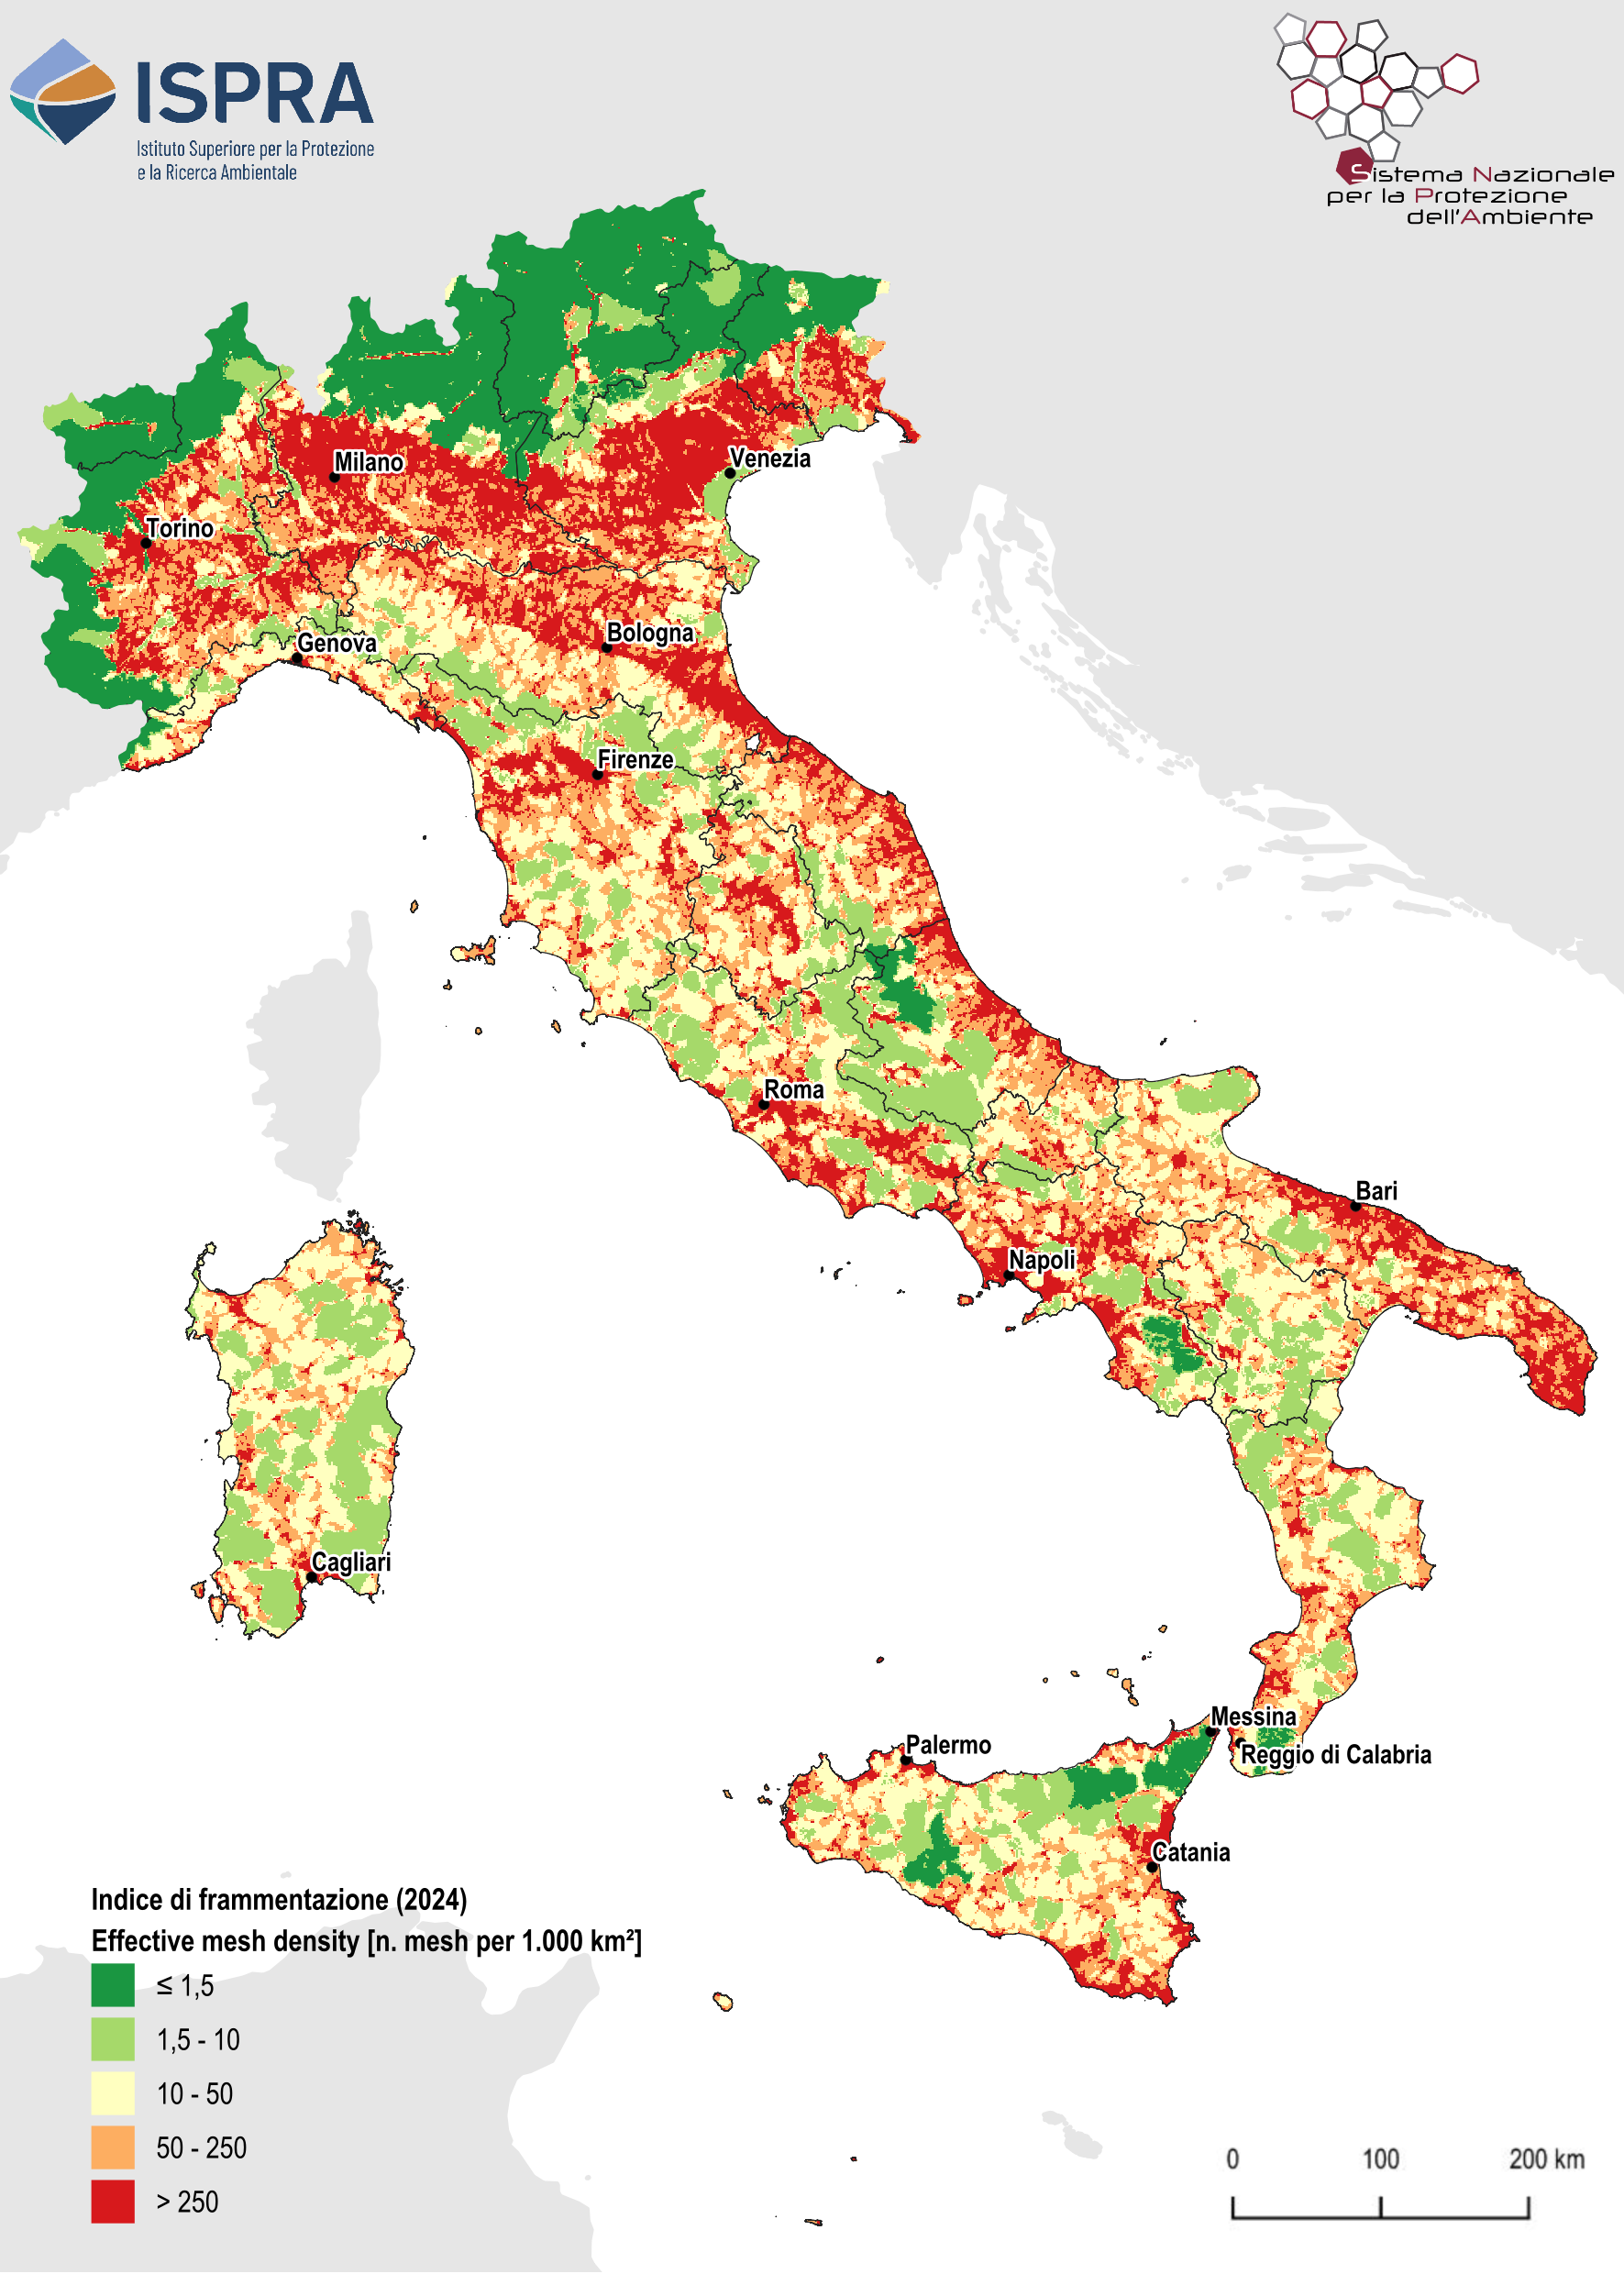
In line with the indicator implemented by the European Environment Agency (Landscape fragmentation indicator – effective mesh density, Seff), five classes corresponding to increasing levels of fragmentation were defined (as mesh density increases, land becomes more fragmented):
- very low fragmentation (0–1.5 meshes per 1,000 km²);
- low fragmentation (1.5–10 meshes per 1,000 km²);
- medium fragmentation (10–50 meshes per 1,000 km²);
- high fragmentation (50–250 meshes per 1,000 km²);
- very high fragmentation (>250 meshes per 1,000 km²).
In 2024, 42.41% of the national territory shows a high or very high degree of fragmentation, and overall 18.64% falls within the very high fragmentation class (Table 1). The regions with the largest territorial share of very high fragmentation are Veneto (39.73%), Lombardy (33.73%), Emilia-Romagna (25.22%), Puglia (25.22%), and Campania (25.76%) (Table 1).
The status described by these data cannot be formally assessed in the absence of objective reference thresholds. The degree of fragmentation is closely correlated with the level of land take affecting the territory.
Temporal changes in fragmentation levels are correlated with trends in artificial land cover and its spatial density across the national territory. The continuous increase in artificial surfaces recorded nationwide results in progressively higher levels of fragmentation of agricultural and natural land.
Between 2012 and 2024, areas with very high fragmentation increased by 2.50% (Table 3), while compared with 2006 they increased by 6.69% (Table 2). Areas with high fragmentation show a more limited increase: +0.16% compared with 2012 and +1.30% compared with 2006. The extent of areas with medium fragmentation did not change significantly between 2012 and 2024, whereas a reduction of 1.21% is observed relative to 2006. The most significant changes mainly affected low-fragmentation areas between 2012 and 2024 (–2.55%) (Table 3) and very low fragmentation areas between 2006 and 2024 (–5.42%) (Table 2).
Fragmentation trends are updated annually, as the availability of new land take data allows refinement of estimates across the entire historical series.
| Allegati |
|---|
Titolo
Table 1: Land coverage by fragmentation class (2024) Fonte
ISPRA calculations based on SNPA cartography Note
The table shows the composition of the national territory and the 20 regions in terms of the percentage of land occupied by each of the five fragmentation classes. |
Titolo
Table 2: Change in the extent of fragmentation classes, as a percentage compared to 2006 (2006-2024) Fonte
ISPRA calculations based on SNPA cartography Note
The table shows the change in the area occupied by fragmentation classes at national and regional level, in terms of percentage change compared to the initial extent of the classes in 2006. |
Titolo
Table 3: Change in the extent of fragmentation classes, as a percentage compared to 2012 (2012-2024) Fonte
ISPRA calculations based on SNPA cartography Note
The table shows the change in the area occupied by fragmentation classes at national and regional level, in terms of percentage change compared to the initial extent of the classes in 2012. |
Thumbnail
Titolo
Figure 1: Fragmentation Index (2024) Fonte
ISPRA processing on SNPA cartography
|
Analysis of 2024 data shows that almost one quarter of the territory (23.77%) falls within the high fragmentation class, while areas with medium fragmentation cover just over one quarter of the national territory (26.58%) (Table 1).
At the regional level, Valle d’Aosta and Trentino–Alto Adige are dominated by low fragmentation classes due to the large extent of mountainous areas. In other northern regions, the coexistence of the Po Valley and Alpine contexts leads to a predominance of extreme classes (very high and very low fragmentation). In Lombardy and Veneto, high levels of low- and medium-density urbanization are associated with large shares of very highly fragmented land, whereas in Central–Southern Italy and the Islands, areas with medium fragmentation prevail.
Regional changes in 2024 relative to 2006 (Table 2) and 2012 (Table 3) indicate a general increase in land fragmentation. Over the 2006–2024 period, very low fragmentation areas decreased in 11 out of 20 regions, and low fragmentation areas decreased in 13 regions. In northern regions, a reduction in “high” fragmentation areas is observed, attributable to a further increase in fragmentation and their transition to the “very high” class. The latter increased in all regions except Valle d’Aosta, for both reference periods considered. High fragmentation areas expanded in the South and Islands at the expense of medium, low, and very low fragmentation classes.
The reduction in ecological connectivity resulting from increased fragmentation negatively affects both the resilience of habitats and their capacity to provide ecosystem services, as well as wildlife access to resources due to increased isolation and vulnerability. The negative effects of fragmentation also indirectly impact human activities and quality of life, through the loss of landscape quality and value and through effects on agricultural activities, such as higher production costs and increased fuel consumption for field operations.