Serena Bernabei, Marilena Insolvibile
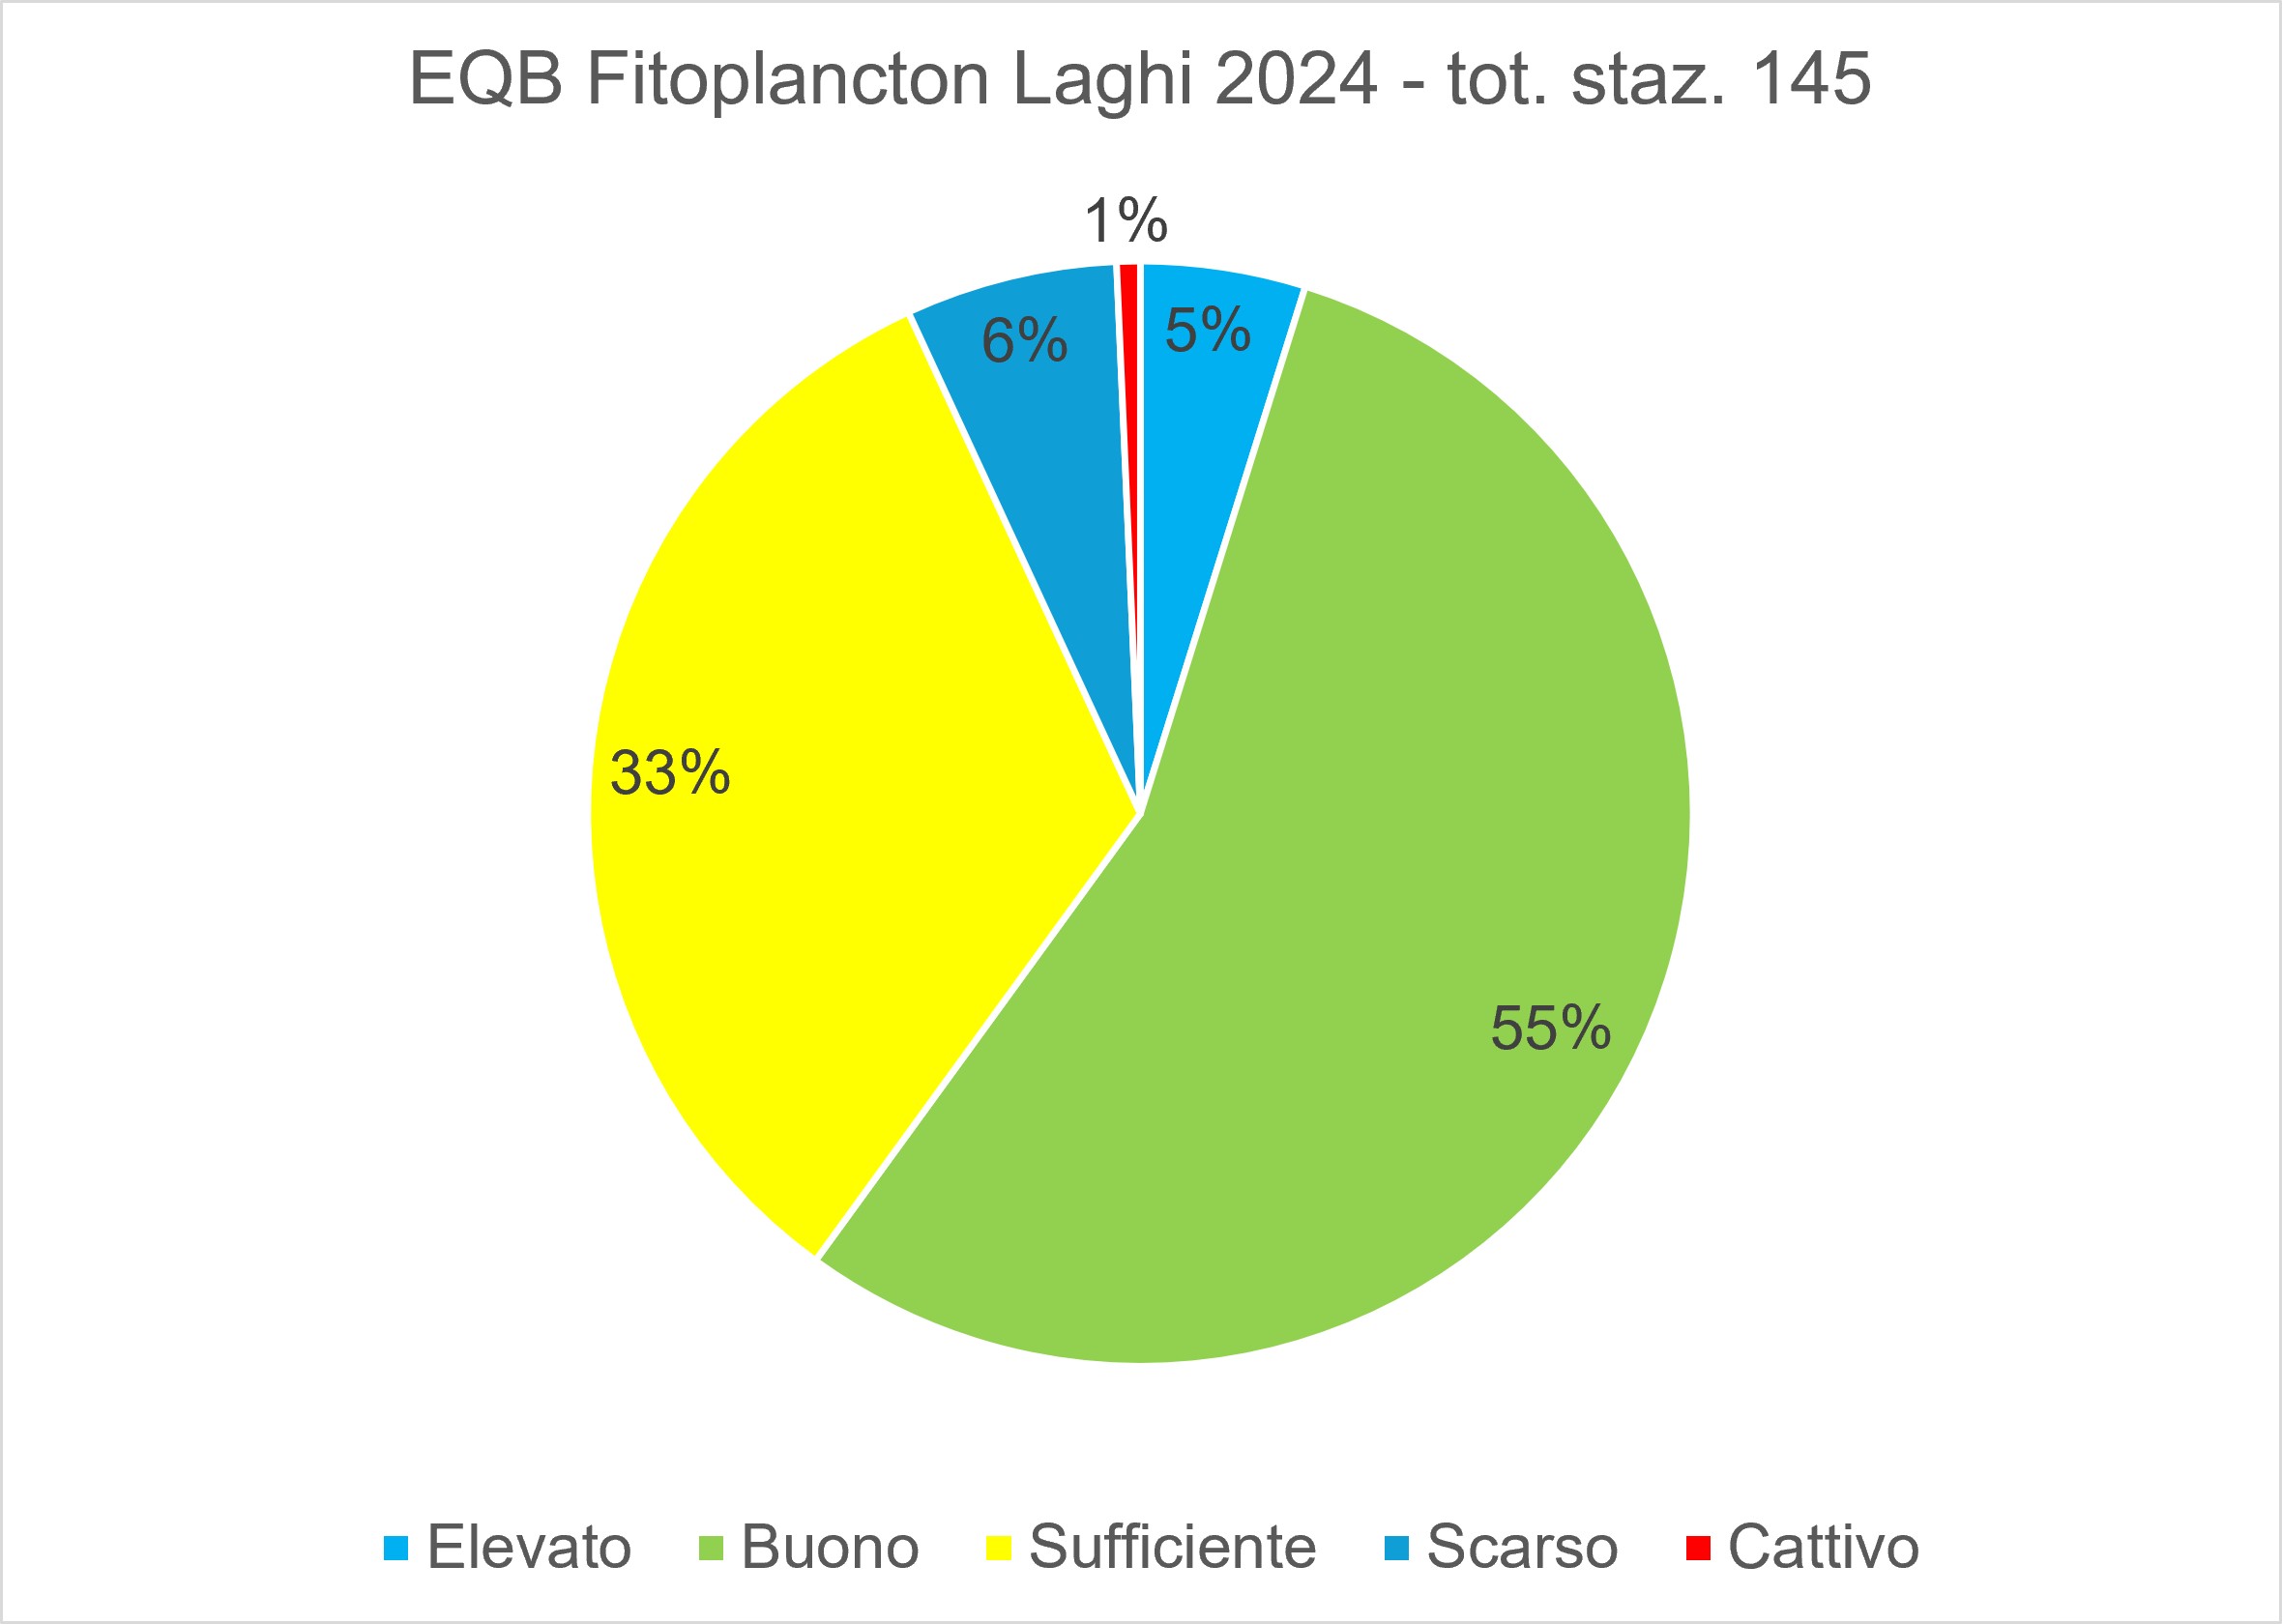
The indicator derives from the application of the reference legislation for the determination of the ecological status of surface water pursuant to Directive 2000/60/EC. From the data transmitted under the WISE 2 flow reported in 2024, it is found that the EQB Fitoplankton was monitored in 145 stations and in 60% of them reaches the ecological status "good or higher". In the remaining 40% of the stations, there is a state of lower quality than the good.
The indicator represented derives from the application of the reference legislation for the determination of water quality, which provides for the classification of water bodies through the integration of different indicators, with the validity times of the sex management plans. The same data are also transmitted annually through the WISE-SoE data stream to the European Environment Agency. The monitoring data submitted for WISE-SoE are due in accordance with Regulation (EC) No 401/2009 of the European Parliament and of the Council of 23 April 2009 on the European Environment Agency and the European Environment Information and Observation Network. Annually, therefore, the monitoring data of the stations that the individual agencies have identified in their annual monitoring plans are transmitted by the ARPA/APPA, completing the space coverage at the end of the six-year cycle. With regard to lakes and reservoirs, the classification of the ecological quality status based on phytoplankton is obtained by evaluation of the overall index for phytoplankton, ICF. This descriptor derives from the standardized EQR average of two indices, the average biomass index and the composition index. Based on the value of the ICF index, expressed as an EQR value from 0 to 1, it is possible to proceed with the classification of lakes in one of the 5 quality classes, from bad to high. Quality classes are graphically represented with standard colors: High (blue), Good (green), Sufficient (yellow), Poor (orange), Bad (red).
It allows to derive the quality class for phytoplanktonic organisms for the definition of ecological status for lake water bodies.
Water Framework Directive (2000/60/EC);
D. Lgs. 152/06 ss. mm. ii
DM 260/2010
According to D. Lgs. 152/06 and ss. mm. ii., all lake water bodies must achieve the environmental quality target corresponding to the "good" state by 2015.
Article 77 also defines the conditions for the use of extensions or derogations from this obligation. The environmental status of a surface water body is given by the worst between the chemical state and the ecological state, defined in accordance with Annex 1 to D. Lgs. 152/06 and ss. mm. ii.
The classification of ecological status is based on the evaluation of biological quality elements (EQB) and physico-chemical, chemical (specific pollutants) and hydromorphological elements, according to DM 260/2010.
APAT, 2007, Metodi Biologici per le acque. Parte I
The distribution of some taxa can depend on natural factors, regardless of those closely related to the quality of the site. Microscopic recognition may present difficulties.
ARPA/APPA
http://www. sintai. isprambiente. it/faces/public/SOE/index. xhtml (con credenziali)
14 regions and 2 autonomous provinces
2024
For lakes and reservoirs, the classification of the ecological quality status based on phytoplankton is obtained by evaluation of the overall index for phytoplankton, ICF. This descriptor derives from the standardized EQR average of two indices, the average biomass index and the composition index. The average biomass index is obtained from the average of the normalized EQRs of the concentration of chlorophyll “a” and the total biovolume, both calculated on the average value, while the composition index depends on the species-specific characteristics of goodness as indicators, the physiological characteristics (trophic index) and the biomass values of the individual species within the phytoplanktonic associations. The composition index changes according to the different macrotypes associated. Based on the value of the ICF index, expressed as an EQR value from 0 to 1, it is possible to proceed with the classification of lakes in one of the 5 quality classes, from bad to high.
Compliance with regulatory objectives can only be evaluated with the classification data of water bodies at the end of each sex-sensental monitoring cycle.
In 2024 the EQB Fitoplankton of the 145 monitoring stations transmitted, achieves the objective of environmental quality "good or higher" in 60% of them (4.8% in high state and 55.2% in good condition) (Figure 1).
-
| Data |
|---|
Headline
Table 1: Number of monitoring stations transmitted by autonomous region/province and single EQB-Lakes (2024) Data source
ISPRA processing on data transmitted by ARPA/APPA for WISE 2 data stream |
Headline
Table 2: Number of stations transmitted by autonomous region/province and by quality classes - EQB Fitoplankton Lakes (2024) Data source
ISPRA processing on data transmitted by ARPA/APPA for WISE 2 data stream |
Thumbnail
Headline
Figure 1: Percentage distribution quality classes - EQB Fitoplankton Lakes (2024) Data source
ISPRA processing on data transmitted by ARPA/APPA for WISE 2 data stream Data legend
Quality Classes: 1 High, 2 Good, 3 Sufficient, 4 Poor, 5 Bad |
ARPAs monitor internal surface water bodies (rivers and lakes) for the determination of ecological status pursuant to Directive 2000/60/EC; monitoring is distinguished in surveillance, operational and investigation according to specific purposes and objectives. With regard to biological quality elements (EQB), monitoring programmes differ in duration, choice of EQBs to be monitored and frequency of measurements; therefore, during the reference six years for the classification of bodies of water, within the period of validity of the management plan, the water bodies to be monitored with an annual programming are identified. It follows that the comparability of EQB quality status data is ensured at the end of each sex-sensental cycle.
The data transmitted by the ARPA/APPA within the WISE 2 data stream for lakes relate to the EQB Fitoplankton, Macrophyte and Pisces, based on the layered monitoring performed in 2024, pursuant to D. Lgs. 152/06 and ss. mm. ii. Table 1 also shows the other EQBs monitored in the lakes under the Water Directive, even if not transmitted within the WISE 2 data stream. These data have been requested from 2021 monitoring and will increase in subsequent data streams. The examination shows that the most monitored and transmitted EQB is phytoplankton (Table 1), while the other EQBs are still unrepresentative at national level.