Giovanni Finocchiaro, Andrea Gagna, Mariangela Soraci
The PRTR Register provides an annual overview of the quantities of waste transferred outside the boundaries of industrial installations subject to reporting obligations. The 2023 update shows that the industrial sector (excluding waste and wastewater management activities – Annex I to Regulation (EC) No 166/2006) transferred a total of 13 million tonnes (Mt) of special waste, of which 9.7 Mt were non-hazardous and 3.2 Mt hazardous. Compared with 2022, quantities show a slight decrease (–7.6% for non-hazardous waste and –14.3% for hazardous waste).
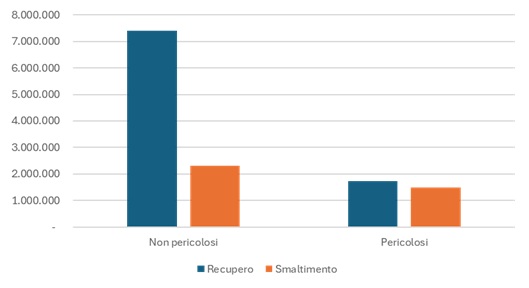
Material recovery remains the preferred destination, accounting in 2023 for 76% of non-hazardous waste and almost 54% of hazardous waste.
The indicator represents, for the years observed, the total amount of hazardous and non-hazardous waste transferred off site from installations reporting to the national PRTR. As with PRTR indicators related to emissions to air and water, the observed sample consists of the largest industrial installations operating nationwide.
Although waste transfer quantities may be determined through measurements, calculations, or estimates as provided for by the reference legislation, the majority of reported data are based on direct measurement of waste weight. Qualitative and quantitative information on waste transfers is collected through PRTR declarations, in accordance with the criteria established by the legislation (Article 5 of Regulation (EC) No 166/2006; Presidential Decree No 157/2011; Article 30 of Legislative Decree No 46/2014).
Installation operators are required to report waste transfers when, in the reference year, they have transferred:
- more than 2 tonnes of hazardous waste, or
- more than 2,000 tonnes of non-hazardous waste.
Total waste quantities are further detailed by type of treatment (recovery or disposal) and destination (Italy or abroad). In the case of cross-border transfers of hazardous waste, operators must also provide information on the final treatment facility abroad.
To provide qualitative and quantitative information on the annual quantities of hazardous and non-hazardous waste transferred off site by PRTR installations, as declared to the national PRTR Register.
- Regulation (EC) No 166/2006
- Presidential Decree No 157/2011
The PRTR data collection system—based on self-reporting by installations and validation by competent authorities—allows room for further improvement in the completeness and quality of the database.
The inclusion of waste treatment facilities among the categories covered by the PRTR may introduce potential double counting in aggregated data on waste quantities presented in this indicator.
ISPRA
https://industry. eea. europa. eu/
National
2007-2023
Aggregations and disaggregations by geographical parameters and PRTR codes.
In 2023, off-site waste transfers by the industrial sector (i.e. excluding waste and wastewater management facilities) amounted to 9.7 Mt of non-hazardous waste and 3.2 Mt of hazardous waste. 76.2% of non-hazardous waste and 53.6% of hazardous waste were sent for recovery, demonstrating the stable role of valorisation chains (Figure 1).
The largest quantities of non-hazardous waste originate from the metal industry (4.6 Mt), followed by mineral products (1.3 Mt) and energy-related activities (1.3 Mt). For hazardous waste, the main contributors are again the metal industry (1.6 Mt) and the chemical industry (0.8 Mt) (Table 4).
Overall conditions—slightly declining volumes combined with a good share of recovery—support a “medium” status assessment.
For the industrial sector, comparison between 2023 and the base year 2007 (Table 1) shows a 27.8% reduction in transferred non-hazardous waste and a 32.7% increase in hazardous waste. Within this long-term framework, time series show fluctuations but no structural changes since 2015; therefore, the trend is assessed as stable.
Regarding cross-border flows, the share of hazardous waste exported by industry remains limited compared with total production, whereas for the waste management sector such transfers represent much larger volumes (Tables 2 and 3). Overall, these elements confirm a generally regular pattern, characterised by limited variations and by a distribution of destinations that does not substantially alter the overall picture over time.
| Data |
|---|
Headline
Table 1: Total quantities of waste transferred off-site (hazardous and non-hazardous) from PRTR "industry" activities Data source
ISPRA, PRTR National Register |
Headline
Table 2: Annual exports of hazardous waste from the industrial sector (PRTR sectors 1-4 and 6-9) Data source
ISPRA, PRTR National Register |
Headline
Table 3: Annual exports of hazardous waste from sector PRTR 5 – Waste and Wastewater Management Data source
ISPRA, PRTR National Register |
Headline
Table 4: Quantity of hazardous and non-hazardous waste transferred off-site by PRTR sector (2023) Data source
ISPRA, PRTR National Register |
Thumbnail
Headline
Figure 1: Waste recovery and disposal of PRTR "industry" plants in 2023 Data source
ISPRA |
Thumbnail
Headline
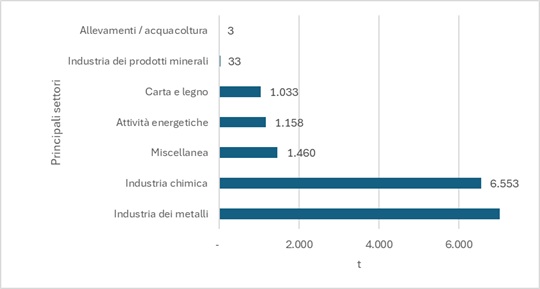
Figure 2: Main PRTR sectors exporting hazardous waste in 2023 Data source
ISPRA |
PRTR-validated declarations show that in 2023 industry sent more than three quarters of its non-hazardous waste to recovery (76.2%) and just over half of its hazardous waste (53.7%), leaving 23.8% and 46.3%, respectively, for disposal (Figure 1).
As regards cross-border transfers, industrial installations exported 69,671 tonnes of hazardous waste in 2023, corresponding to 2.2% of the total hazardous waste declared (Table 2). The main contributors were the metal industry, chemical industry, and the “Miscellaneous” group (Figure 2).
Focusing on installations in the “Waste and wastewater management” group, exports take on a different scale: in 2023, these operators exported significantly larger quantities of hazardous waste than the industrial sector (Table 3). This difference reflects the fact that such facilities treat and route waste flows from multiple productive sectors and therefore handle larger overall volumes.
The sectoral distribution of off-site waste transfers confirms the dominant role of the metal industry, mineral products, and energy activities for non-hazardous waste, and of the metal and chemical industries for hazardous waste, as shown in Table 4.
Overall, the indicator depicts a system characterised by strong differentiation between productive sectors and waste management facilities, with a relatively limited contribution of industrial exports and a prevalence of recovery operations in total declared flows.