Stefania Ercole
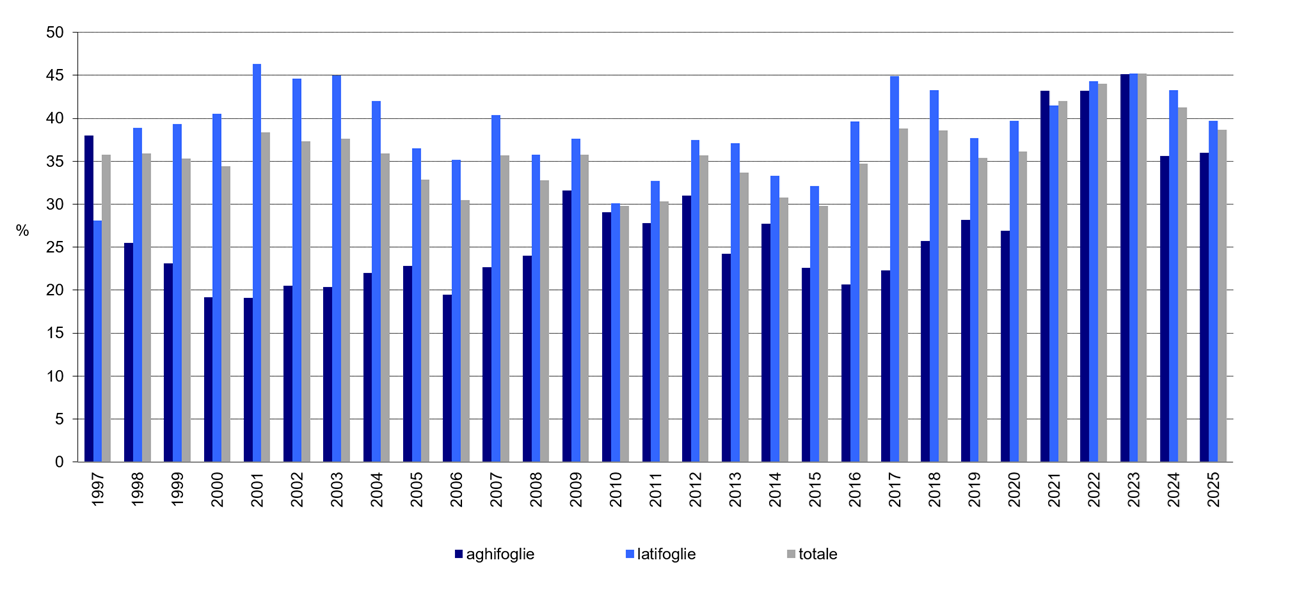
The defoliation values indicate the level of resilience or susceptibility of the species to the impact caused by atmospheric deposition and gaseous pollutants. The data collected over the last 29 years (1997-2025) show a fluctuating trend until 2020, with years of attenuation and years of growth of the phenomenon and greater sensitivity of broad-leaved trees. Starting from 2021, however, a worsening of the phenomenon was recorded, with very high defoliation values, never reached before. These values, in 2023, reached 45% for broad-leaved and needle-leaved trees. This trend eased in 2024 and 2025, the year in which values dropped to 36% defoliation for coniferous trees and 39.7% for broadleaf trees.
Impact indicator expressed through the average annual values of defoliation of the canopy of forest species (needle and broad-leaved trees), recorded from 1997 to 2025 within a network of permanent areas identified within the National Integrated Program CON. ECO. FOR. (Forest Ecosystem Controls), started in 1995 by the State Forestry Corps and now carried out by the Carabinieri Command for the Protection of Biodiversity and Parks. The monitoring is carried out within permanent areas (254 Level I areas + 31 Level II areas) distributed throughout the national territory and representative of the main Italian forest communities.
Provide information on the conditions of the crowns of the main broad-leaved and needle-leaved forest species present in Italy, in order to highlight their level of resilience or susceptibility with respect to the impact caused by atmospheric deposition and gaseous pollutants.
The indicator responds to the requirements of the international agreements signed by Italy within the ICP Forests (International Cooperative Program on Assessment and Monitoring of Air Pollution Effects on Forests operating under the UNECE Convention on Long-range Transboundary Air Pollution (CLRTAP) and the MCPFE (Ministerial Conference on the Protection of Forests in Europe).
The CON. ECO. FOR. Program conducts forest monitoring activities on the basis of the UN/ECE International Convention on Long-Range Transboundary Air Pollution and in implementation of the Community Regulation on the monitoring of forests and environmental interactions.
Ministry of Agricultural and Forestry Policies, 1999. CONECOFOR programme. First report 1999.
ANPA, 2000. Indicators of Sustainable Forest Management. State of the Environment Series 11/2000.
UNECE, BFH, 2005. The Condition of Forests in Europe, 2005 Executive Report.
https://www. carabinieri. it/arma/oggi/associazione/associazione-per-la-tutela-forestale-ambientale-e-agroalimentare/progetti-life
The defoliation values may be affected by specific events not directly related to the impact of air pollutants and, therefore, may not be sufficient, on their own, to outline a precise picture of the phenomenon.
Not foreseen.
CUFAA (Carabinieri Forestry, Environmental and Agri-Food Unit Command) - Projects, Agreements, Environmental Education Office;
ICP Forests - CONECOFOR Program (Forest Ecosystem Control)
Request for data from CUFAA (Carabinieri Forestry, Environmental and Agri-Food Unit Command) - Projects, Agreements, Environmental Education Office
National
1997-2025
The indicator reports the percentage distribution of trees sampled in the permanent areas of the CON. ECO. FOR Program. (also distinguished by needle-leaved and broad-leaved trees). The monitoring is carried out within 2 networks of test areas: a network of 254 areas called Level I and a network of 31 intensive monitoring areas, called Level II; the areas are distributed throughout the national territory and are representative of the main Italian forest communities.
Defoliation is visually assessed by adequately trained personnel assisted by specific reference manuals and expressed in 5 classes, defined as follows: 0 = 0-10%, no damage; 1 = >10-25%, minor damage; 2 = >25-60%, moderate damage; 3 = >60-<100%, serious damage; 4 = 100%, dead trees.
The temporal analysis of the phenomenon is carried out on the basis of the trends in the percentage of trees with defoliation greater than 25%.
The state can be defined as poor considering the fact that the percentage of trees with a degree of defoliation greater than 25%, which corresponds to the damage threshold value, is significant and likely to cause concern (Figure 1, Table 1). In fact, 25-60% of defoliation involves moderate damage, 60-100% serious damage, followed by the death of tree individuals.
In the period between 1997 and 2020, the total defoliation values averaged 35%, with fluctuations over the different years. In the two-year period 2017-2018 the phenomenon worsened (values close to 39%), and then improved again in 2019-2020 with values of 35-36% on average. Defining a trend is not easy due to the fluctuating nature of the phenomenon, but since 2021 there has been a marked worsening which indicates a negative trend, as values above 40% were detected, never reached in the 28 years of surveying (Figure 1, Table 1). This trend seems to have weakened in 2024 and 2025, therefore the trend will need to be confirmed or revised based on the findings of the next few years.
| Allegati |
|---|
Titolo
Table 1: Percentage distribution of sampled trees by defoliation class and species category Fonte
CUFAA - Office of Projects, Partnerships, and Environmental Education; ICP Forests - CONECOFOR Program (Forest Ecosystem Monitoring) Legenda
Defoliation classes. Class 0: 0–10%, no damage; Class 1: >10–25%, slight damage; Class 2: >25–60%, moderate damage; Class 3: >60–<100%, severe damage; Class 4: 100%, dead trees Note
* The total values in parentheses represent the percentage breakdowns of the total sample |
Thumbnail
Titolo
Figure 1: Annual trend in the percentage distribution of sampled trees for which a defoliation level > 25% (classes 2–4) was recorded Fonte
CUFAA - Office of Projects, Partnerships, and Environmental Education; ICP Forests - CONECOFOR Program (Forest Ecosystem Monitoring) |
The data collected over the last 29 years (1997-2025) in the permanent monitoring areas distributed in Italian forests as part of the CON. ECO. FOR. Program show a fluctuating trend in the defoliation phenomenon, with greater sensitivity recorded from 1998 to 2020 for broad-leaved trees (Figure 1). From 2021, a marked increase in defoliation values was observed for both broad-leaved and needle-leaved trees, with total values reaching 45% in 2023 (Table 1), and then improving in 2024 (41.3%) and 2025, the year in which the overall values stood at 38.7%: in particular 36% for needle-leaved trees and 39.7% for broad-leaved trees (Figure 1). It will be verified, on the basis of the findings of the next few years, whether this improvement will persist.
When evaluating these results, it must be considered that in addition to the impact of atmospheric deposition and gaseous pollutants, there are many stress factors that can influence the vegetative conditions of species, among these just think of the influence of climate trends, but also of parasitic attacks or fires.