Anna Cacciuni, Caterina D'Anna
The indicator makes it possible to measure the capacity to minimize the environmental impact of the project subject to the Environmental Impact Assessment (EIA) decision, by imposing binding and mandatory environmental conditions on both the construction and operation of the project. The indicator highlights the trend over the years of the total number and the average number, per decision, of environmental conditions included in EIA decisions.
In order to determine the indicator, all environmental conditions imposed by the Ministry of the Environment and Energy Security (MASE), the Ministry of Culture (MIC), the Regions and local authorities and included in EIA decisions were analysed, identifying those whose compliance verification falls under the responsibility of the National System for Environmental Protection (SNPA). In the period June 1989–2024, an average of 28 environmental conditions per decision is recorded, with a minimum of 6 in 1989 and a maximum of 72 in 2006.
The indicator represents the number and categories of environmental conditions included in EIA decisions. It highlights the trend over the years of the total number of environmental conditions and the average number of environmental conditions per decision.
For the construction of the indicator, all environmental conditions included in EIA decisions, imposed by MASE, MIC, the Regions and local authorities, were analysed and counted. In addition, the environmental conditions involving the SNPA were identified starting from 1995 (the year of establishment of ANPA and ARPA/APPA – Law 01/1994).
To measure the capacity to minimize the environmental impact of the project subject to the decision, by imposing binding and mandatory conditions on the construction and operation of the project itself.
Legislative Decree 152/2006 and subsequent amendments.
Legislative Decree no. 104 of 2017
DL 34/2020 converted with Law 77/2020
DL 76/2020 converted with Law 120/2020
DL 77/2021 Simplification Decree converted into Law no. 29 July 2021, n. 108
-
Verification of compliance with the environmental conditions imparted through the EIA measures.
Ministry of the Environment and Energy Security (MASE)
https://va. mite. gov. it/it-IT
National
June 1989 - 2024
EIA decisions were examined and all environmental conditions contained therein, issued by MASE, MIC, the Regions and local authorities, were analysed and counted. All environmental conditions involving the SNPA and those falling under the competence of MASE were identified.
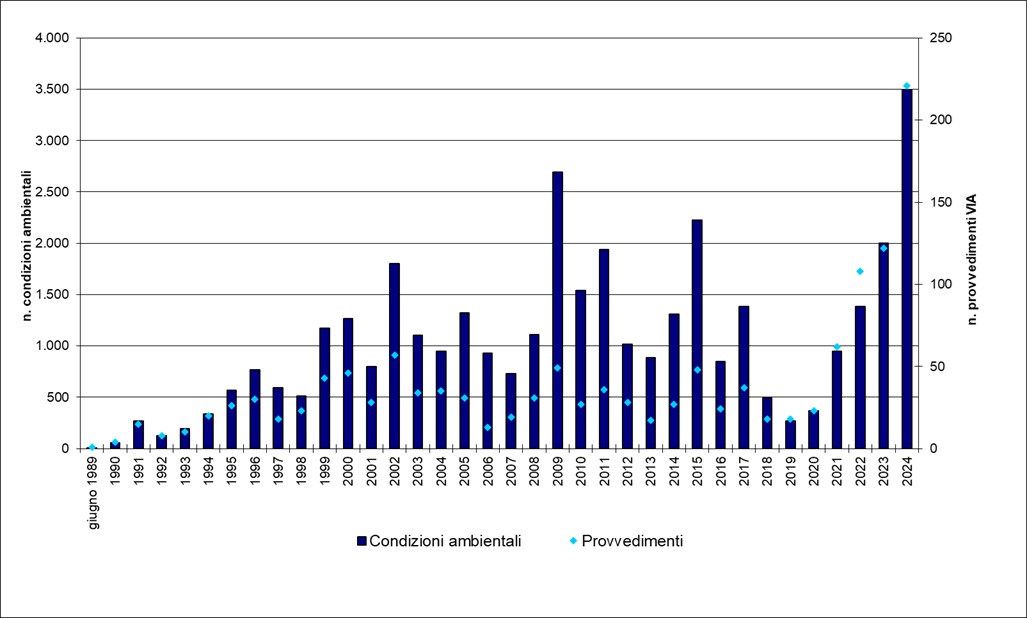
In 2023 and 2024, the average number of environmental conditions per decision stands at 16 (Table 1). An analysis of the last two years shows an increase both in the number of decisions issued and in the average number of environmental conditions per decision (Table 1 and Figure 1).
In the period June 1989–2024, 1,357 EIA decisions were issued, with 37,414 environmental conditions, corresponding to an average of 28 conditions per decision. The average number of environmental conditions increased from 6 in 1989 to 72 in 2006, then decreased to 13 in 2022, followed by a slight increase in 2023 and 2024 (up to 16) (Table 1).
The application of the EIA procedure in Italy reflects developments at the European level: the regulatory framework has been strengthened and completed over time through the transposition of European Directives; public participation and administrative transparency have increased; and the quality of environmental impact studies for projects subject to EIA has improved.
For these reasons, a positive trend can currently be identified, as in recent years a decrease in the average number of environmental conditions has been observed, indicating greater attention by project proponents to the preparation of environmental impact studies.
| Data |
|---|
Headline
Table 1: Number of positive EIA decisions, number of environmental conditions, average number of environmental conditions per decision Data source
Source: ISPRA processing based on MASE data |
Headline
Table 2: Number of environmental conditions and related percentage whose compliance verification is assigned to the Agency System (ISPRA–ARPA/APPA) Data source
Source: ISPRA processing based on MASE data |
Thumbnail
Headline
Figure 1: Trend in the number of environmental conditions and EIA decisions Data source
ISPRA processing based on MASE data |
Thumbnail
Headline
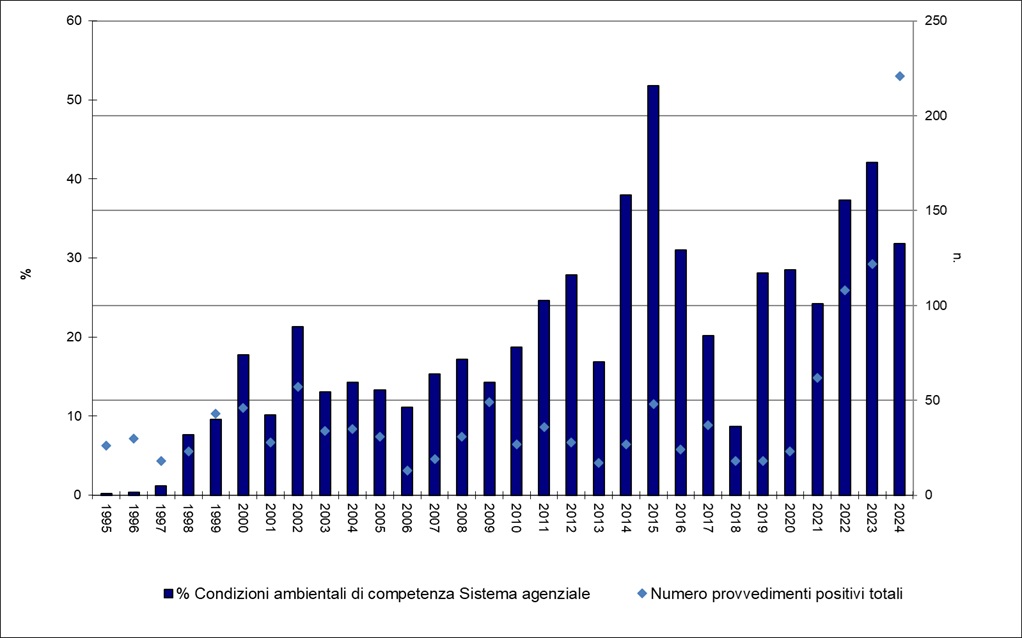
Figure 2: Total number of EIA environmental conditions and environmental conditions whose compliance verification is assigned to the SNPA Data source
ISPRA processing based on MASE data |
Figure 1 shows a similarity between the trends in the number of EIA decisions and the number of environmental conditions. Between 2023 and 2024, an increase in the number of decisions issued was also recorded, while the average number of environmental conditions per decision remained constant.
From Table 2 and Figure 2 it emerges that the environmental conditions whose compliance verification involves the SNPA (period 1995–2024) amount to 8,414, equal to 23% of the total. The percentage of environmental conditions involving the SNPA increased in the initial years, remained almost constant from 2003 to 2009, and rose significantly from 2010 to 2015, reflecting the consolidation of the role played by the SNPA in environmental verification and control activities, before decreasing in recent years.
In 2024, 221 positive EIA decisions were issued, for a total of 3,497 environmental conditions, of which 1,112 (32%) were assigned to the SNPA.