Antonio Caputo
The comparative assessment within the European Union shows that both Italy’s primary and final energy intensity are lower than the EU average. This outcome can be attributed to the historical scarcity of domestic primary energy resources (which fostered the development of energy-efficient infrastructures and consumption patterns, as well as a production structure that is not excessively energy-intensive), to the high fiscal burden on energy (which has raised end-user energy prices above those of other countries), to the lower per capita income level, and to the relatively mild climate. Based on an ascending ranking of gross energy intensity values, Italy occupies the 7th position among European countries.
The indicator measures the energy efficiency of economic systems, namely the amount of energy required per unit of GDP produced. Specifically, gross energy intensity is defined as the ratio between gross inland energy consumption and GDP, whereas final energy intensity is defined as the ratio between final energy consumption and GDP.
To assess the relationship between trends in energy consumption and economic growth, with the objective of enhancing the efficiency of energy use.
With Decision No. 1386/2013/EU, the European Union established the 7th Environment Action Programme (EAP) running until 2020. On 14 October 2020, the European Commission presented the proposal for a decision establishing the 8th Environment Action Programme for the period 2021–2030, which was adopted by the Council of the EU on 29 March 2022. No specific targets are applicable to this indicator.
ENEA, Energy and Environment Report, various years.
EUROSTAT (Ufficio Statistico delle Comunità Europee)
EUROSTAT, https://ec.europa.eu/eurostat/data/database
MASE, National Energy Balance, various years, https://sisen.mase.gov.it/dgsaie/
National
1995-2023
The indicator consists of several parameters:
-
the ratio of gross inland energy consumption to GDP at market prices, expressed in chained 2020 values for a given calendar year;
-
the ratio of final energy consumption to GDP at market prices, expressed in chained 2020 values;
-
intensity by sectors, defined as the ratio of final energy consumption in toe to value added, expressed in chained 2020 values.
In 2023, final energy intensity amounted to 56.5 toe per million euros, representing a 2.8% decrease compared to 2022. Different sectors exhibit markedly different intensities (Table 1). The highest values are found in the mining and manufacturing industry and in agriculture, with 80.4 toe/M€ and 93.5 toe/M€, respectively. Among the sectors with the lowest energy intensity are construction (5.3 toe/M€) and services (13.2 toe/M€).
Despite considerable annual variability, a long-term decreasing trend in final energy intensity is observed, driven by a reduction in energy used per unit of GDP produced. Overall, final energy intensity decreased by 18.5% over the period 1995–2023 (Table 1). Among the different sectors, construction and services recorded significant increases in energy intensity, by 135.7% and 20.3%, respectively, from 1995 to 2023. Conversely, other sectors, particularly industry, contributed to the decline in intensity. Energy intensity in the mining and manufacturing industry fell by 34.7%, while energy intensities in the transport and agriculture & fishing sectors decreased by 14.5% and 8.21%, respectively.
| Data |
|---|
Headline
TABLE 1: SECTORAL & TOTAL FINAL ENERGY INTENSITIES (TOE/VALUE ADDED, 2020 CHAINED VALUES) Data source
Processed by ISPRA based on MASE and EUROSTAT data Data legend
n.d. – data not available; 1 Energy intensity not comparable with other sectors as it is not measured against its own “value added” but relative to GDP; p – provisional |
Headline
TABLE 2: GROSS ENERGY INTENSITY(1) OF GDP AT MARKET PRICES, CHAINED 2020 VALUES Data source
Processed by ISPRA based on MASE and EUROSTAT data Data legend
n.d. – data not available; 1 Defined as the ratio of gross inland energy consumption to GDP; p – provisional data; ° – series break |
Headline
TABLE 3: FINAL ENERGY INTENSITY(1) OF GDP AT MARKET PRICES, CHAINED 2020 VALUES Data source
Elaborazione ISPRA su dati EUROSTAT Data legend
n.d. - dato non disponibile; 1 Definita dal rapporto tra consumo finale (usi eneregetici e non energetici) e PIL; p Dati provvisori; ° Interruzione nella serie |
Thumbnail
Headline
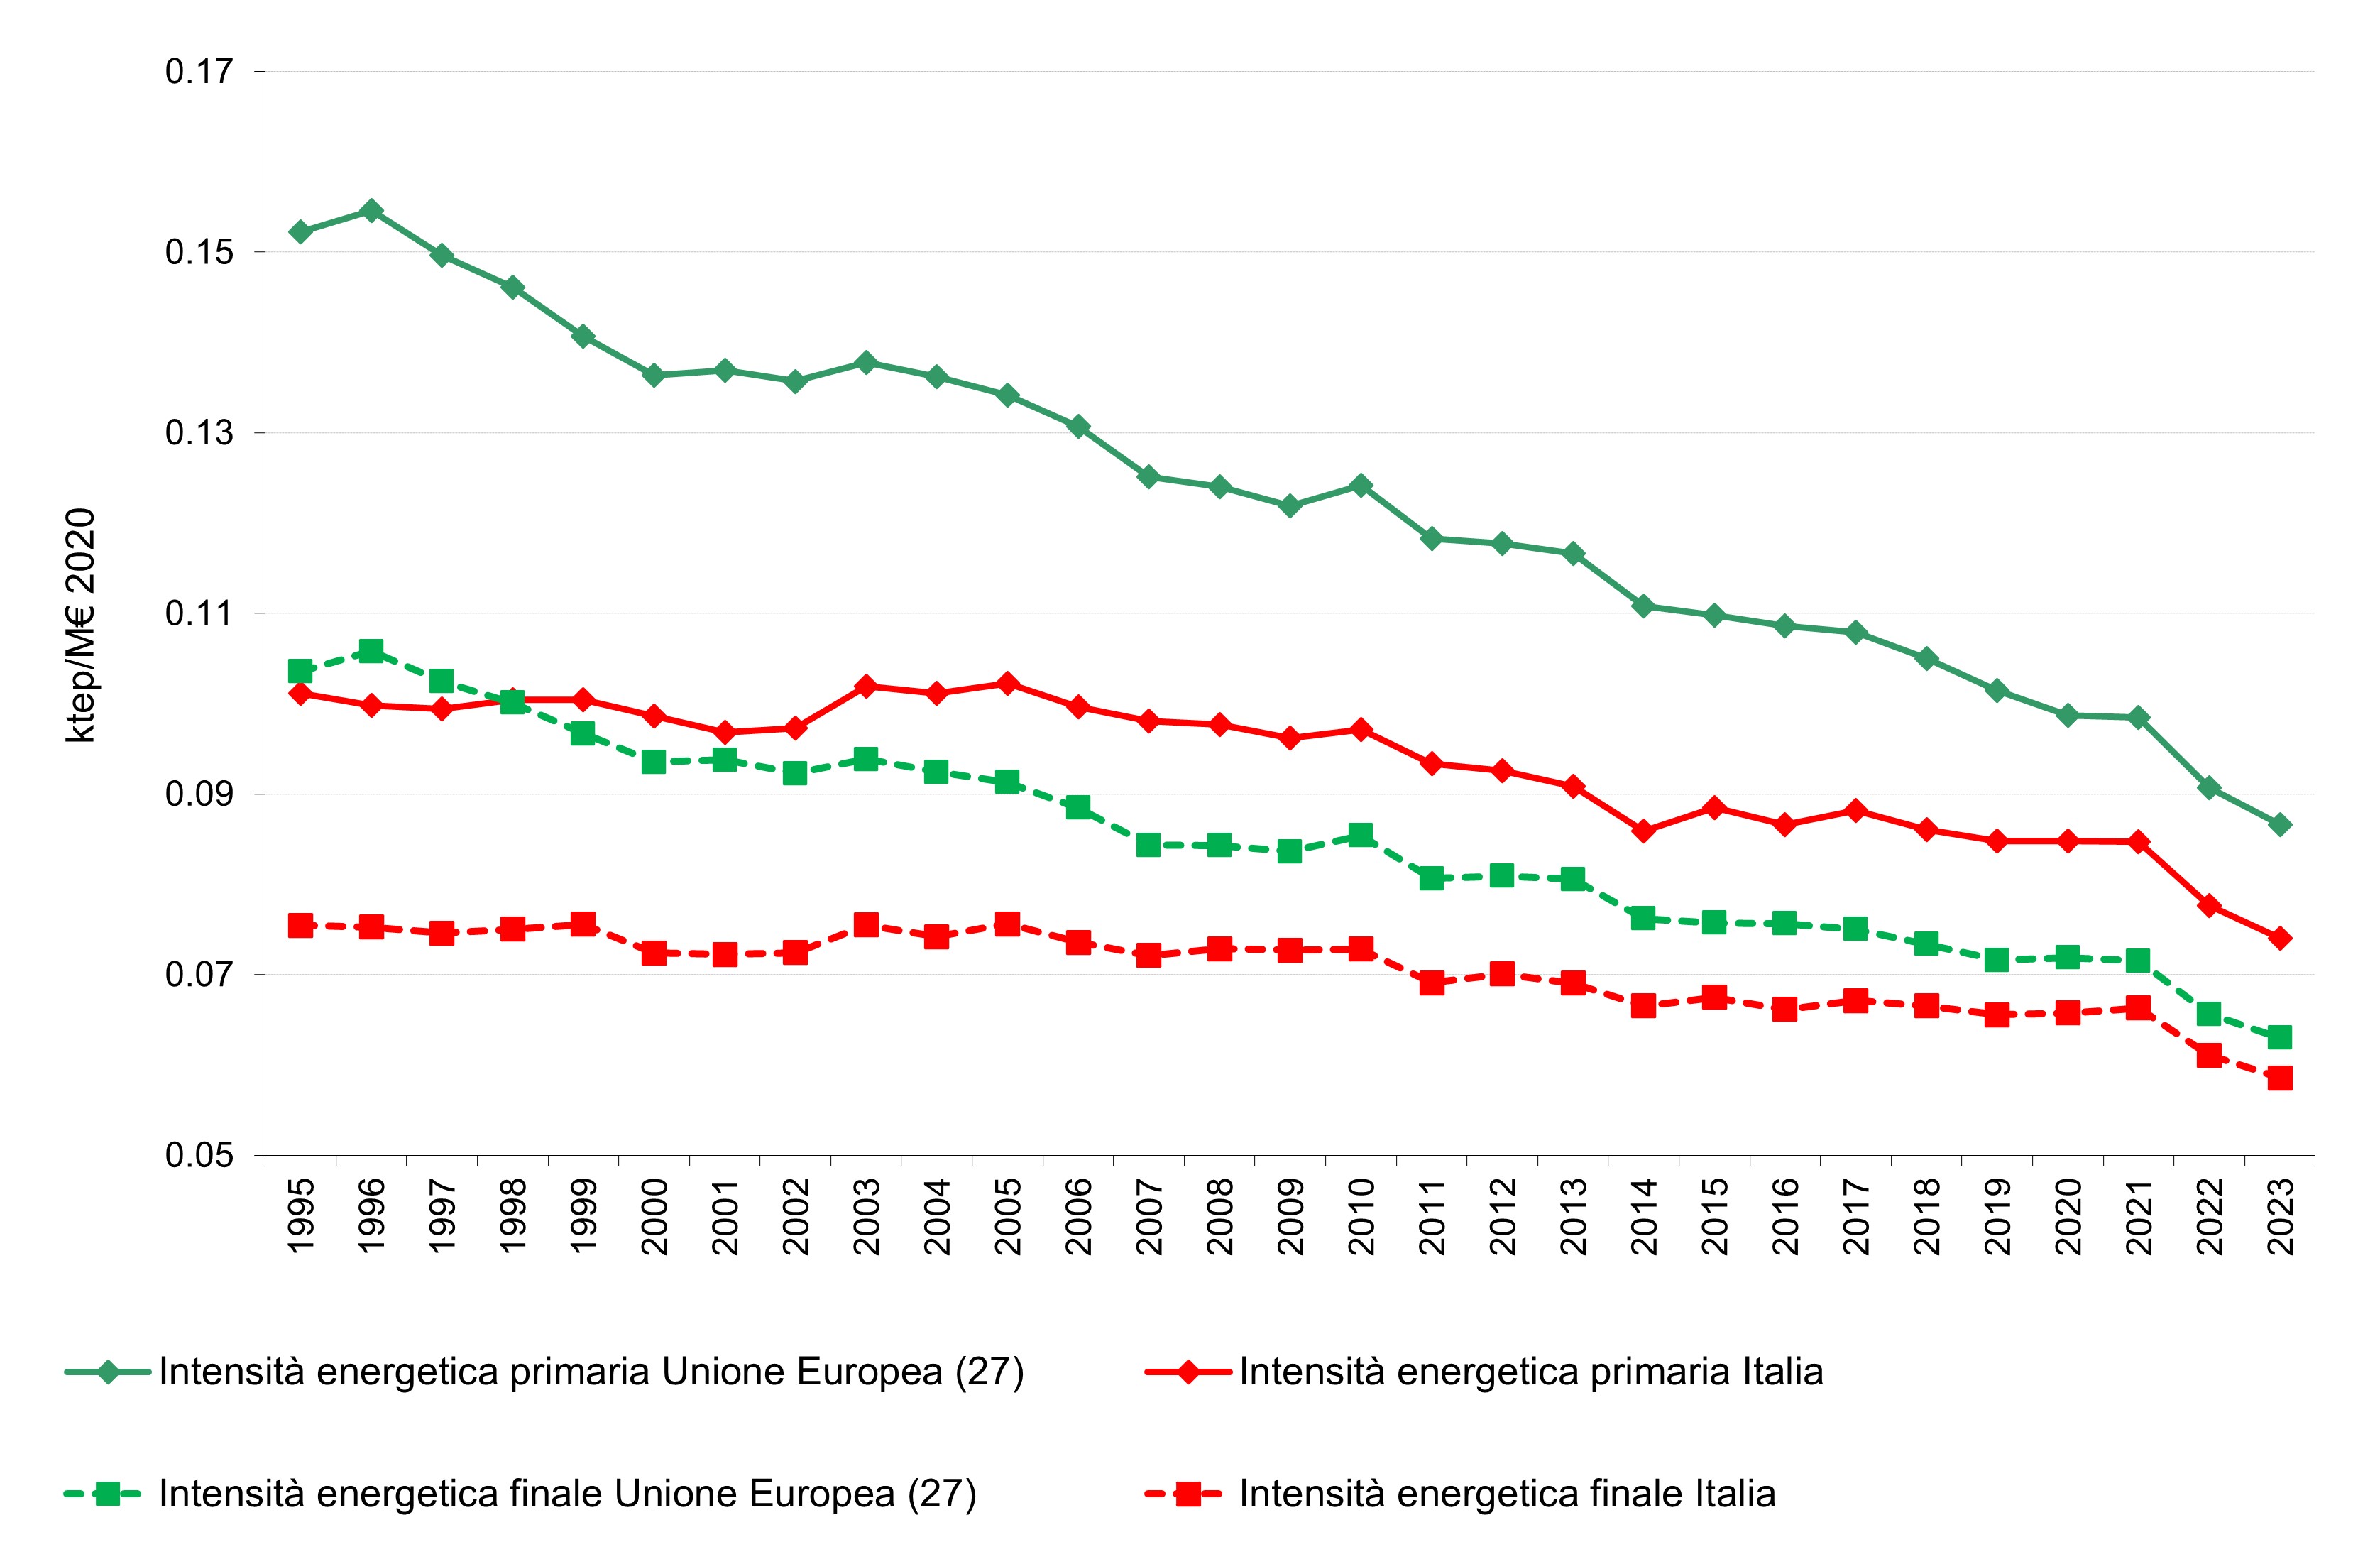
FIGURE 1: PRIMARY ENERGY INTENSITY(1 – SOLID LINE) AND FINAL ENERGY INTENSITY(2 – DASHED LINE) OF GDP AT MARKET PRICES, CHAINED 2020 VALUES IN THE EU AND ITALY Data source
Processed by ENEA based on EUROSTAT data Data legend
1 Defined as the ratio of gross inland energy consumption to GDP; 2 Defined as the ratio of final energy consumption to GDP |
The internal comparison within the European Union highlights that both Italy’s gross and final energy intensities remain below the European average. This is due to the historical scarcity of primary energy resources (which has fostered the development of energy-efficient behaviors and infrastructures, as well as a production structure that is not excessively energy-intensive), to high taxation (which has raised the cost of energy sources for end users well above typical levels in other countries), to lower per capita income, and to the relatively mild climate. Historical series of energy intensity show that the European values for gross and final energy intensity, 86.6 and 63 toe/M€ respectively, are approaching the national levels. According to an ascending ranking of gross energy intensity values, Italy ranks 7th among European countries (Tables 2 and 3, and Figure 1).