Antonio Caputo, Riccardo De Lauretis, Francesca Palomba
The indicator concerns nitrogen oxide (NOₓ) emissions into the atmosphere, which contribute to acidification and eutrophication processes. These emissions originate primarily from combustion processes (such as energy production plants, residential heating, and transport). They can be reduced through technological improvements and/or by treating the gaseous effluents of the processes.
In 2023, energy-related processes accounted for 89.8% of total nitrogen oxide emissions. Since 1990, NOₓ emissions from energy processes have shown a marked decline (–75.4% in 2023 compared to 1990), mainly due to the adoption of emission abatement technologies in both stationary and, above all, mobile sources.
In 2023, total NOₓ emissions were 57.2% lower than in 2005, in line with compliance with international protocols on acidification.
The indicator refers to nitrogen oxide (NOₓ) emissions into the atmosphere, which are a primary cause of acidification and eutrophication processes. These emissions mainly originate from combustion processes (such as power generation plants, residential heating, and transport). They can be reduced through technological improvements and/or by treating the process gas effluents.
To assess the role of energy-related processes in nitrogen oxide (NOₓ) emissions, with the aim of reducing the contribution of energy use to air pollution.
Directive 2001/81/EC on national emission ceilings, transposed into Italian law by Legislative Decree No. 171 of 2004, established a national emission ceiling for NOₓ of 990 kilotonnes to be achieved by 2010 and maintained in subsequent years. The Directive represented the EU transposition of the 1999 Gothenburg Protocol, aimed at combating acidification, eutrophication, and ground-level ozone.
Directive 2001/81/EC was repealed by Directive (EU) 2016/2284, transposed in Italy through Legislative Decree No. 81 of 2018, which set new national reduction commitments for NOₓ emissions. Unlike the previous legislation, the target is no longer expressed as an absolute value, but as a percentage reduction: 40% compared to 2005 levels for each year from 2020 to 2029, and 65% reduction from 2005 levels starting in 2030.
ISPRA, Quality Assurance/Quality Control Plan for the Italian Emission Inventory, Several years, https://emissioni.sina.isprambiente.it/inventario-nazionale/
ISPRA, Informative Inventory Report, Several years, https://emissioni.sina.isprambiente.it/inventario-nazionale/
The relevance of the indicator at the local level is limited due to the uneven distribution of energy production and consumption across the national territory.
To improve data quality at the regional level, detailed information is required for the characterization of emissions from stationary sources (e.g., emission data from point-source plants, personnel operating industrial facilities) and from mobile sources (e.g., vehicle fleet).
ISPRA
ISPRA, Atmospheric Emissions Inventory,
https://emissioni.sina.isprambiente.it/inventario-nazionale/
National
1980-2023
Estimate carried out as part of the preparation of the national emission inventory.
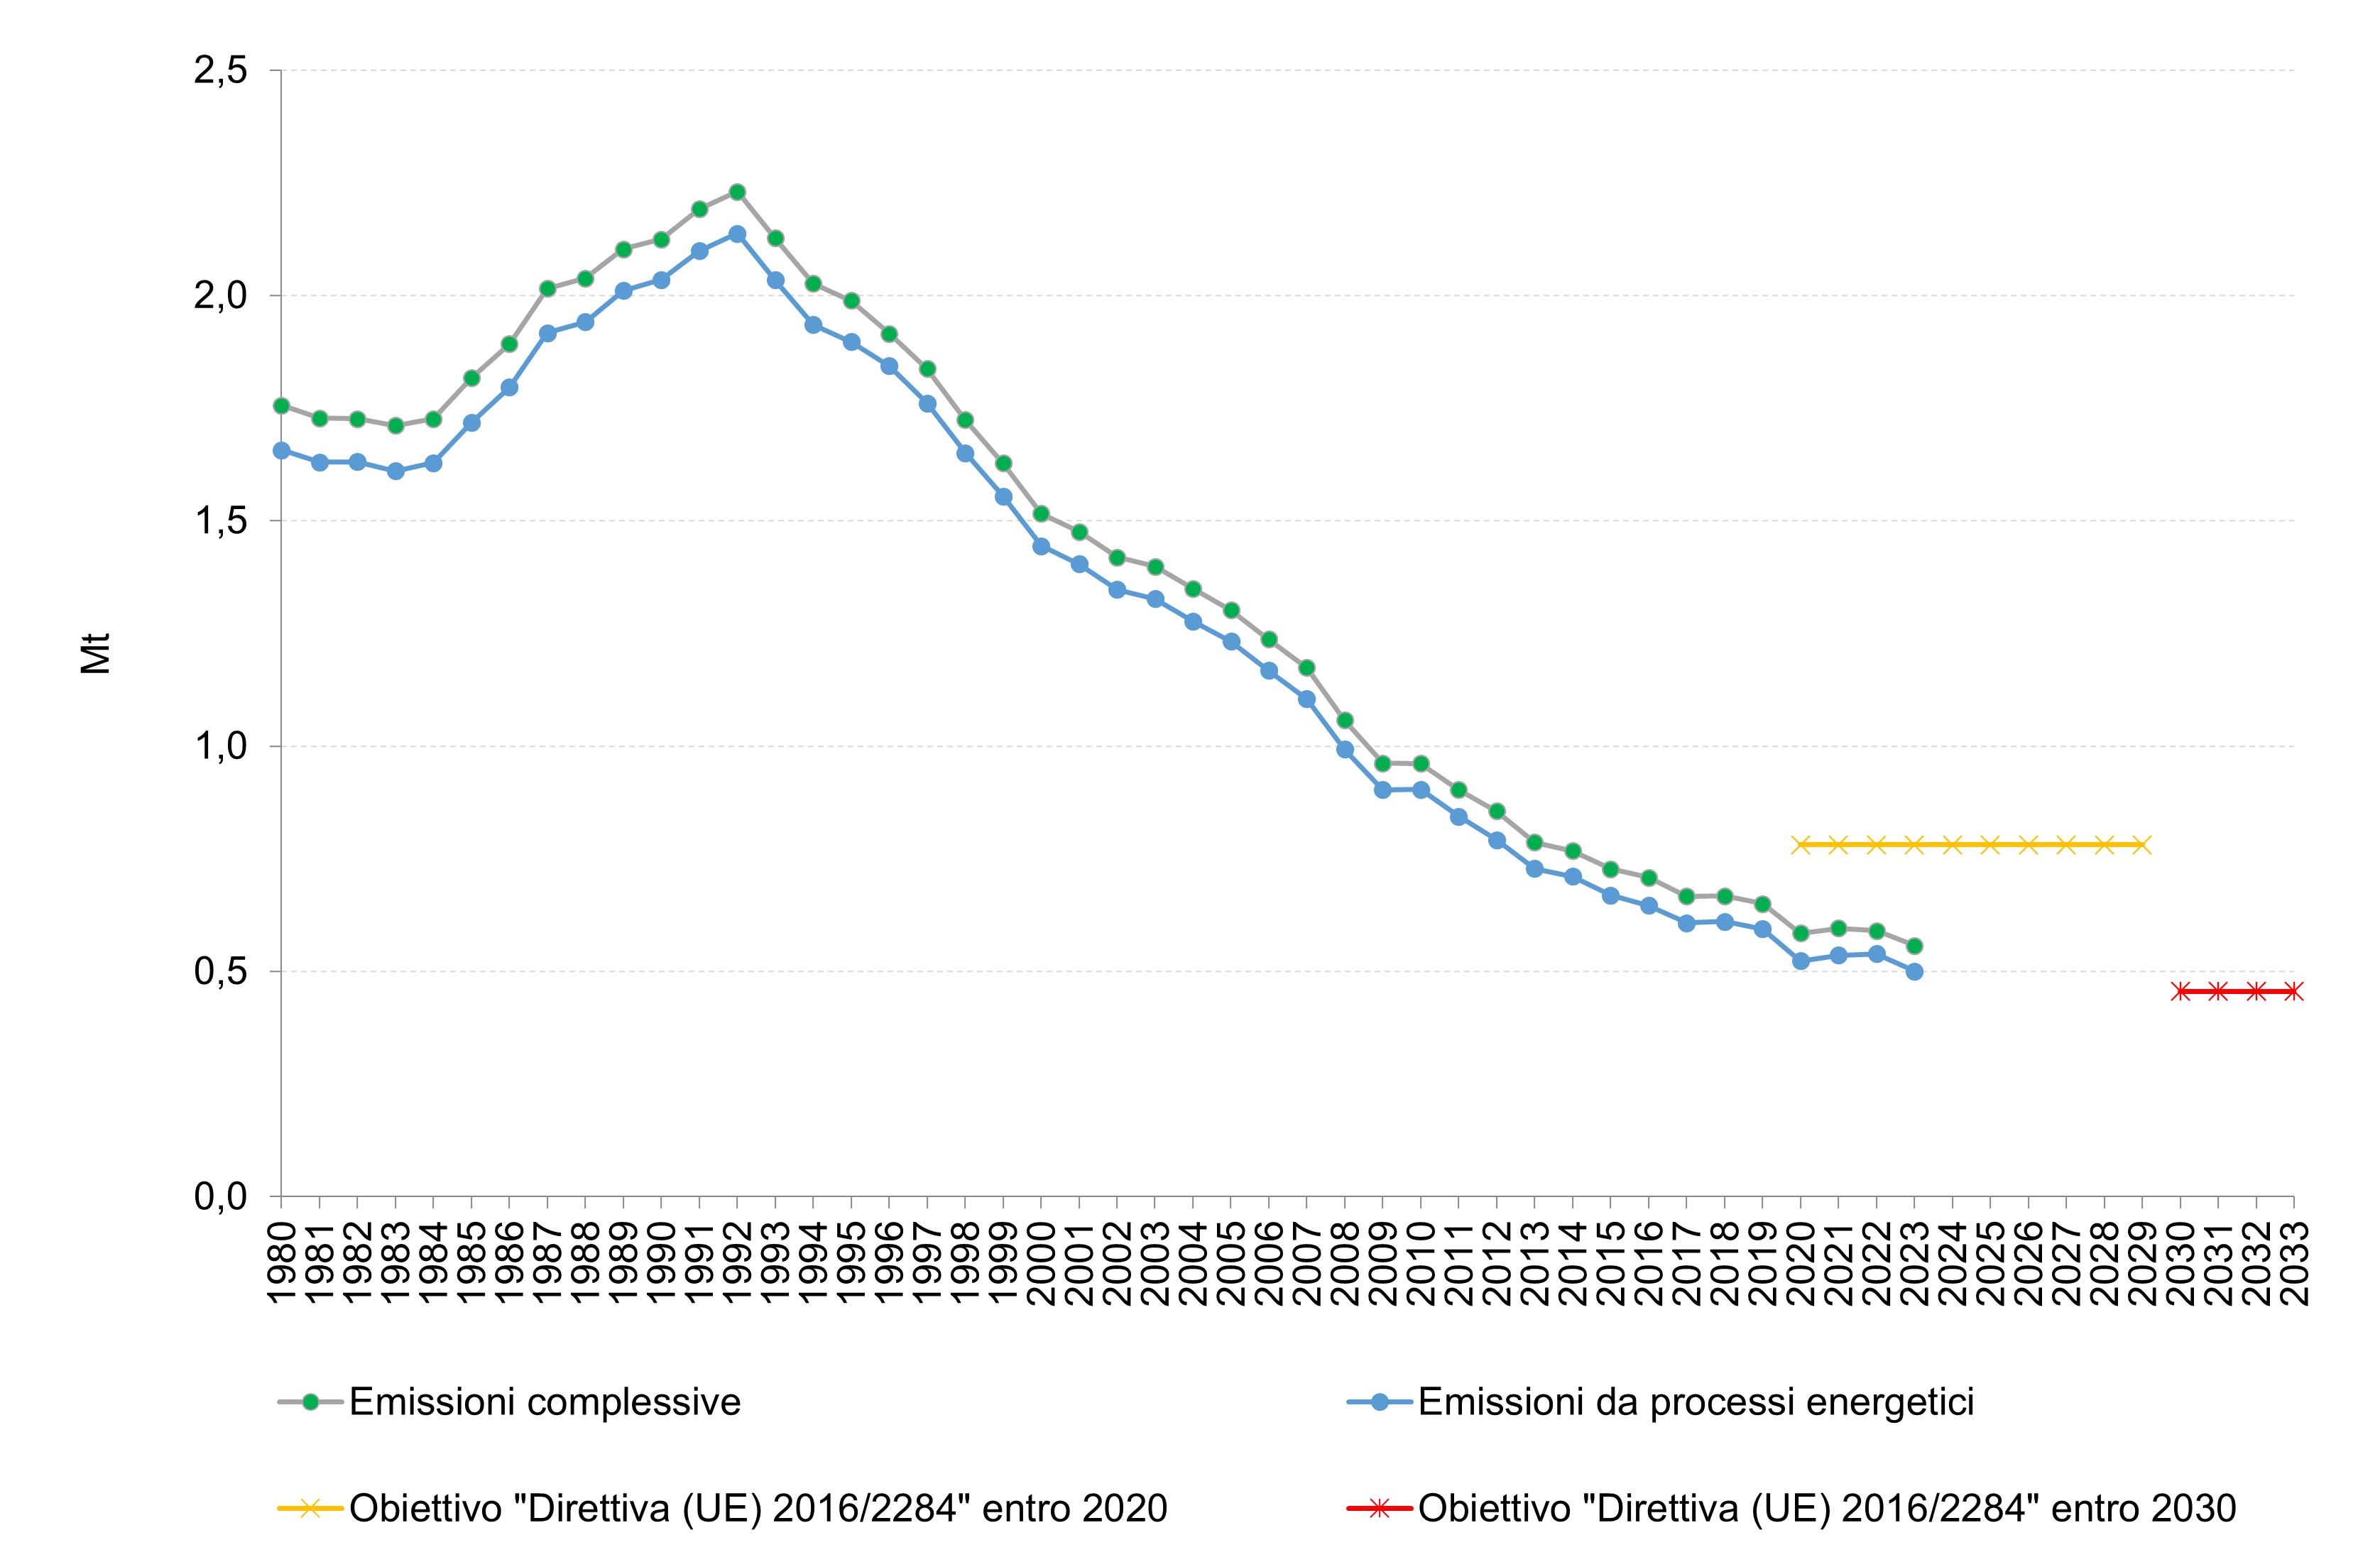
The NEC Directive (2016/2284) established national reduction targets for nitrogen oxide (NOₓ) emissions for any year between 2020 and 2029, and for any year from 2030 onward. Specifically, for Italy, the 2023 target corresponds to 781.19 kt of national NOₓ emissions (calculated as a 40% reduction from 2005 levels). The 2030 target is set at 455.70 kt of national NOₓ emissions (equivalent to a 65% reduction from 2005 levels).
In 2023, the energy sector was responsible for emitting 501 kt of nitrogen oxides into the atmosphere, accounting for 89.8% of total national emissions (Table 1). With a 59.4% reduction compared to 2005 levels, the sector has made a decisive contribution toward achieving the set target.
Since 1990, nitrogen oxide (NOₓ) emissions from energy processes have decreased by 75.4% in 2023 compared to 1990, due to the use of emission reduction devices on stationary plants and especially on mobile sources.
| Data |
|---|
Headline
Table 1: Total Nitrogen Oxide Emissions and Emissions from Energy Processes Data source
ISPRA |
Thumbnail
Headline
Figure 1: Total and Energy-Related Nitrogen Oxide Emissions with Targets Data source
ISPRA |
In 2023, energy processes contributed 89.8% of total nitrogen oxide (NOₓ) emissions. The relative contribution of energy processes to NOₓ emissions has progressively decreased from 95.8% in 1996 to 89.8% in 2023, due to improved efficiency of NOₓ emission control systems in the energy sector (Table 1 and Figure 1). To ensure the consistency and comparability of the inventory, the annual update of emissions involves revising the entire historical series based on available information and the latest methodological developments.