Antonio Caputo
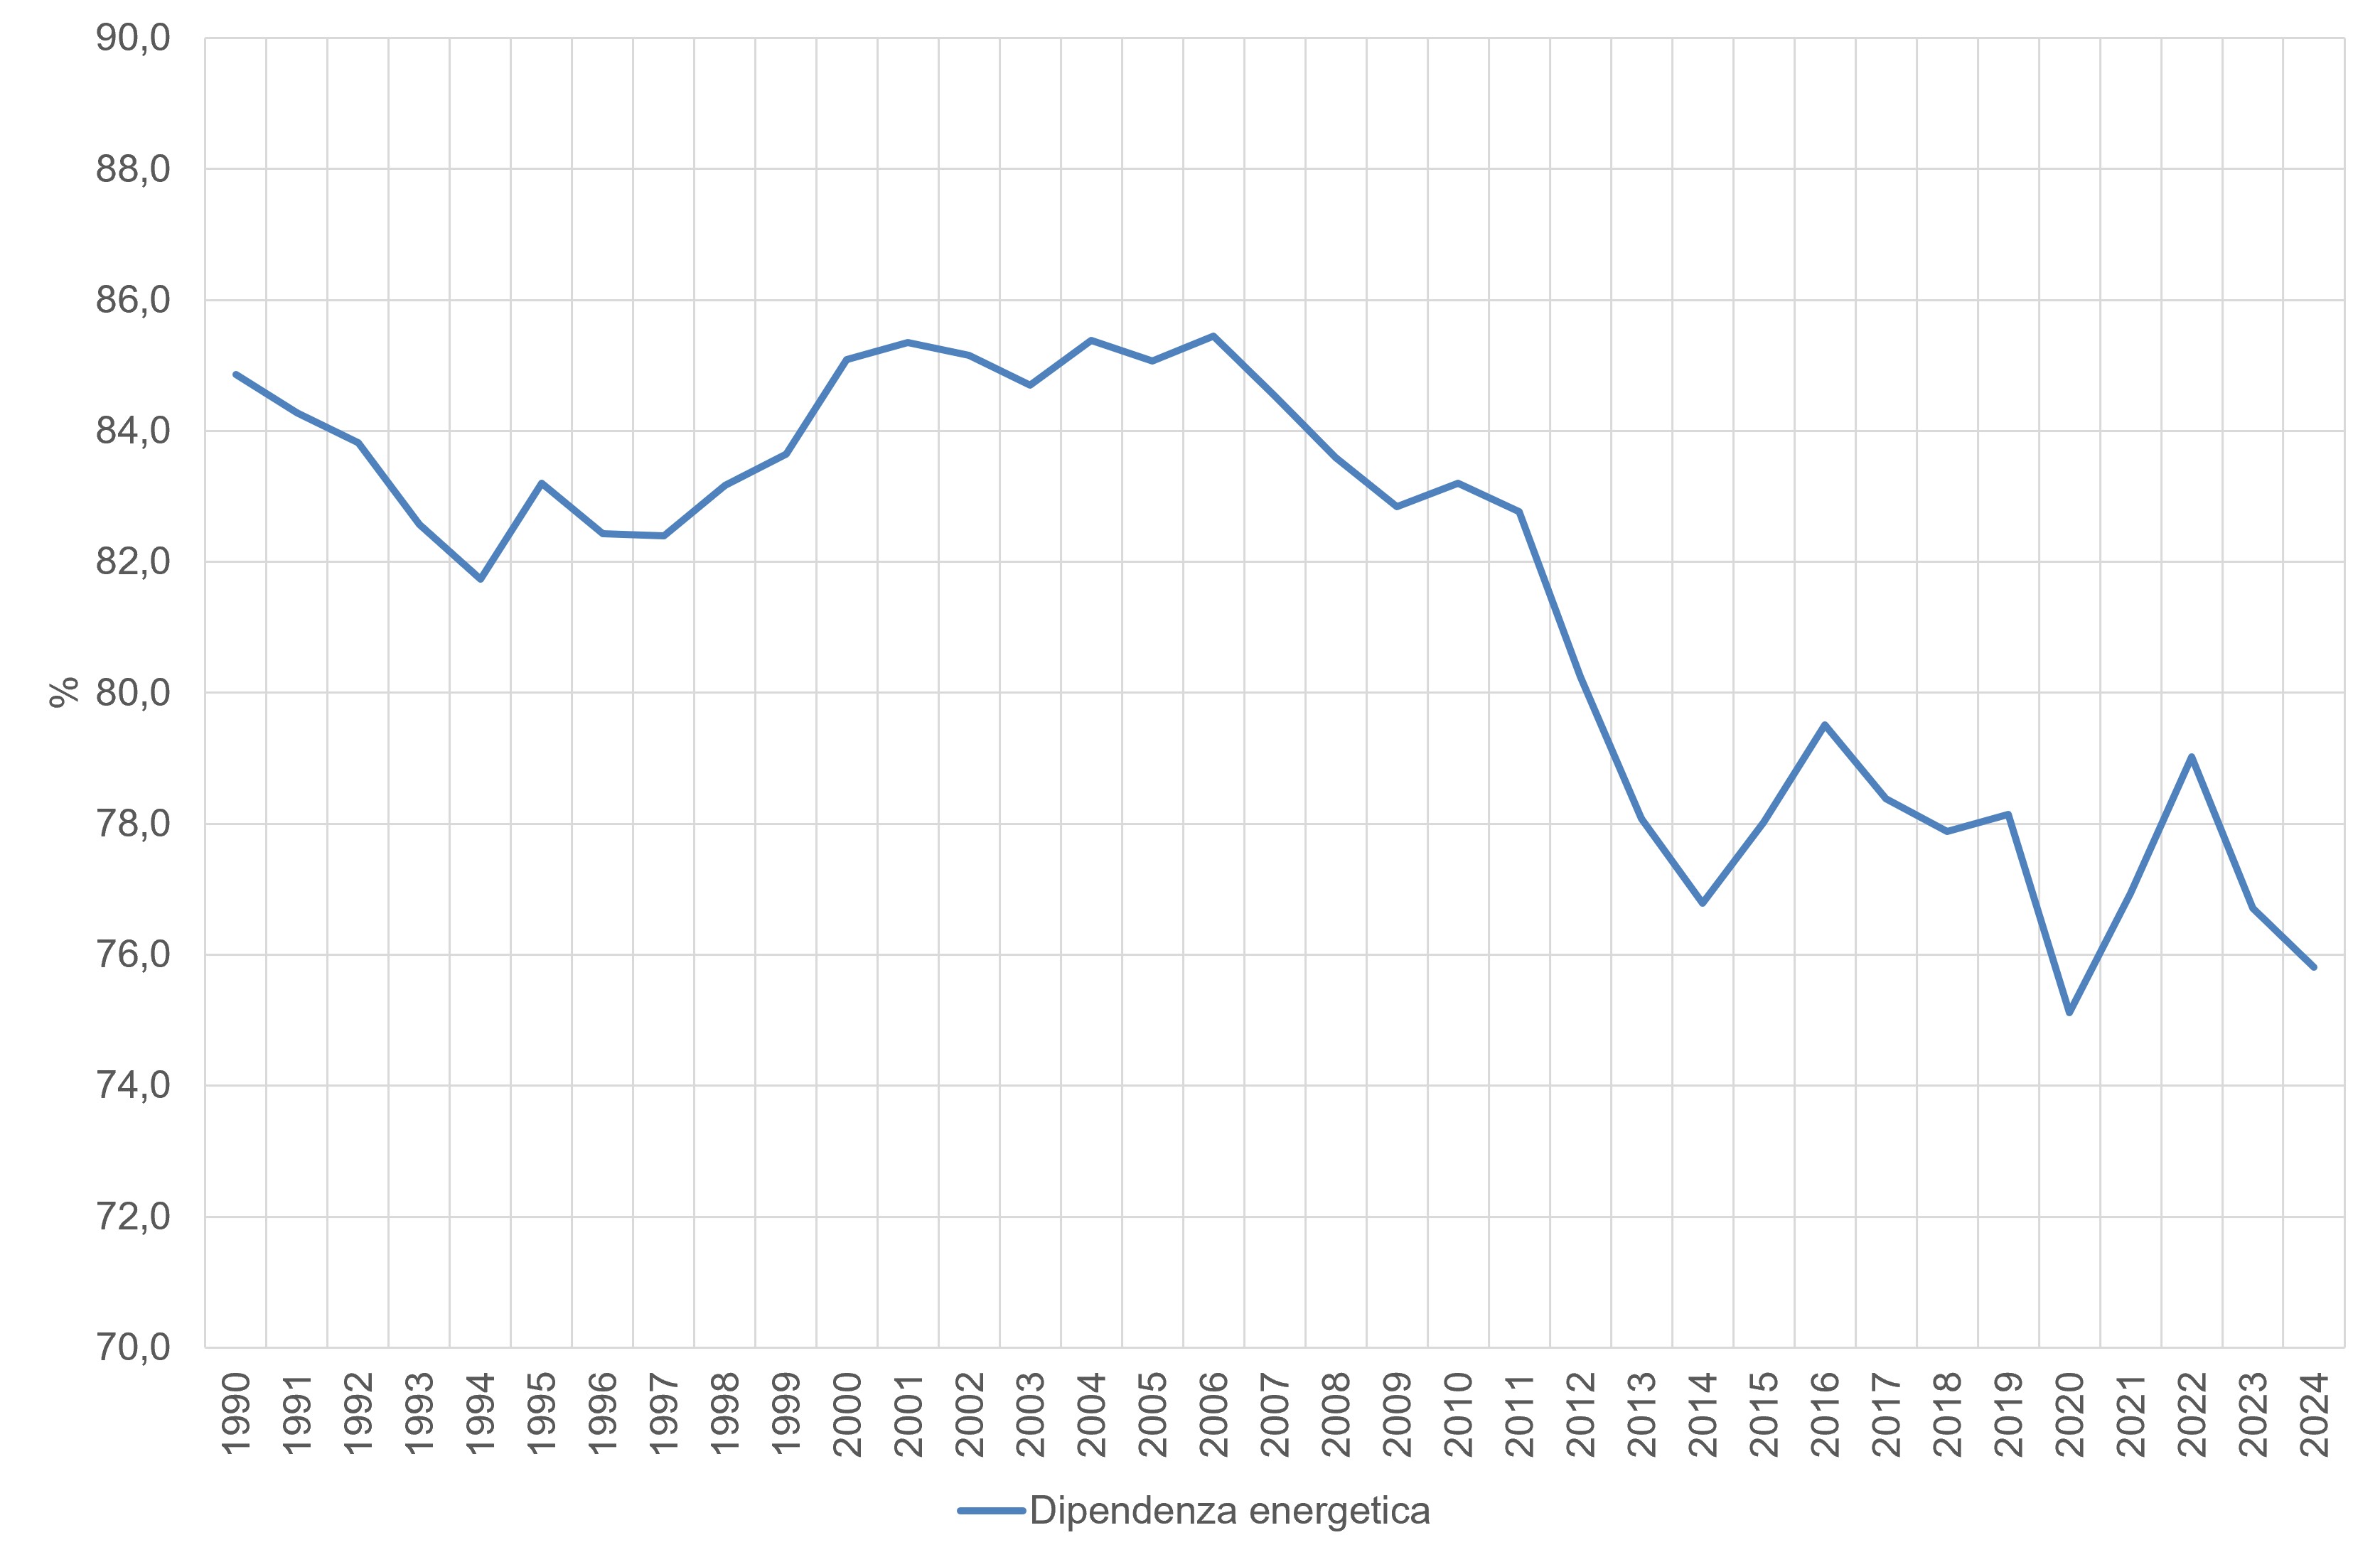
The indicator monitors the level of dependence on foreign supplies to satisfy gross domestic energy needs, expressed as a percentage value for each individual energy source (Solid Fuels, Oil, Natural Gas, Renewables) and as a whole (Total). The decrease in the share of oil and the increase in the share of energy from renewable sources determines the decrease in national energy dependence. Since 2007, a reduction in energy dependence has been observed, which went from the maximum value of 85.5% in 2006 to the minimum of 75.1% in 2020. In 2024, dependence recorded 75.8%.
The indicator shows the dependence of the national economy on imports of various energy sources to meet its needs. The indicator is calculated from the ratio between net imports and availability net of inventories.
Provide information relating to the security of resource supply in terms of the level of dependence on imports of energy sources and primary electricity.
The European Union's ecological policy framework has evolved from the VII General Action Program (Decision No. 1386/2013/EU), concluded in 2020, to the current VIII Environment Action Program (8th EAP), formally adopted by the Council of the EU on 29 March 2022 and in force until 2030. Despite the absence of legal ceilings or binding limit values applied to imports of energy carriers, this indicator represents a tool essential analytical tool within community policies, strategically oriented towards the decarbonisation of consumption and the pillar of energy efficiency.
MASE, 2024, The national energy situation in 2023
ENEA (Authority for New Technologies, Energy and the Environment), MASE (Ministry of the Environment and Energy Safety), Eurostat
MASE, National energy balance link: https://sisen. mase. gov. it/dgsaie/
Eurostat database at the following link: https://ec. europa. eu/eurostat/data/database
National
1990-2024
The indicator is calculated from the ratio between net imports and availability net of inventories. This indicator, together with other energy statistics, is an integral part of the European Statistical System (ESS).
The 2024 data outline a national energy system characterized by an almost total dependence on foreign countries for traditional fossil fuels. Solid fuels record an import rate of 100.0%, resulting in a total absence of exploitable internal production. A similar situation is found for natural gas and petroleum products, whose foreign supply quotas stand at 95.8% and 95.5% respectively, leaving national production with a marginal share of less than five percent. On the contrary, renewable sources show the lowest dependency ratio of the basket, equal to just 6.1%, a value that reflects the intrinsically local and self-produced nature of the vast majority of green energy (while the small remaining share is linked to cross-border trade or imported biomass). In this context, the country's total energy dependence index stands at 75.8%, a share which, while remaining high, highlights how overall internal production manages to cover approximately a quarter of national energy needs (Table 1).
The historical evolution of the data shows profoundly divergent dynamics between fossil fuels and the renewables sector, with an important impact on the overall trend. Solid fuels already start from very high levels of dependence in 1990 (98.0%) and, through minimal fluctuations, reach total saturation of 100.0% starting from 2016, maintaining it stably until 2024. Petroleum products fluctuate constantly throughout the thirty-year period between a minimum of 92.5% and a maximum of 97.9%, without ever reversing course. Natural gas, on the other hand, shows a more marked import growth trend: in 1990 Italy imported 64.3% of its gas, but this share has risen progressively and in an almost linear way, exceeding 80% in 2002 and 90% in 2015, until reaching the historical peak of 95.8% in 2024. Renewable sources show an opposite and highly dynamic trend: their foreign dependence rises from 1.4% in 1990 to a peak of 13.3% in 2011, and then began a decisive and constant decline that halved this value, bringing it back to 6.1% in 2024. Under the pressure of these forces, the national total figure shows a structural contraction: after having reached a peak of dependence of 85.5% in 2006, the value constantly falls to 75.8% of 2024, recording the highest level of energy independence in the last thirty-five years (Table 1 and Figure 1).
| Allegati |
|---|
Headline
Tabella 1: Dipendenza energetica Data source
Elaborazione ISPRA su dati MASE, Eurostat |
Thumbnail
Headline
Figura 1: Dipendenza energetica in Italia Data source
Elaborazione ISPRA su dati MASE, Eurostat |
The trajectories described by the indicator respond to dynamics of energy demand and availability of national, industrial and geopolitical reserves that have affected Italy in recent decades. The total structural dependence on solid fuels and petroleum products is linked to the almost total absence of internal coal deposits and the scarcity of economically exploitable national oil reserves, factors that have always forced the country to turn to international markets. The strong surge in dependence on natural gas can be explained by the reduction of national reserves (particularly in the Po Valley and in the Adriatic) combined with a political and industrial choice that has elected gas as the key fuel of the Italian energy transition, pushing for the construction of large international methane pipelines and regasification terminals. The virtuous trend of the national total and the behavior of renewables are closely connected: the increased penetration of photovoltaic, wind and hydroelectric power in the consumption basket has allowed Italy to generate increasing shares of energy within its borders. Since renewable sources are by their nature indigenous resources, their massive development since the 2000s has allowed an overall reduction in fossil fuels to be imported, allowing the country to significantly improve its level of security and energy self-sufficiency (Table 1).