Marina Vitullo
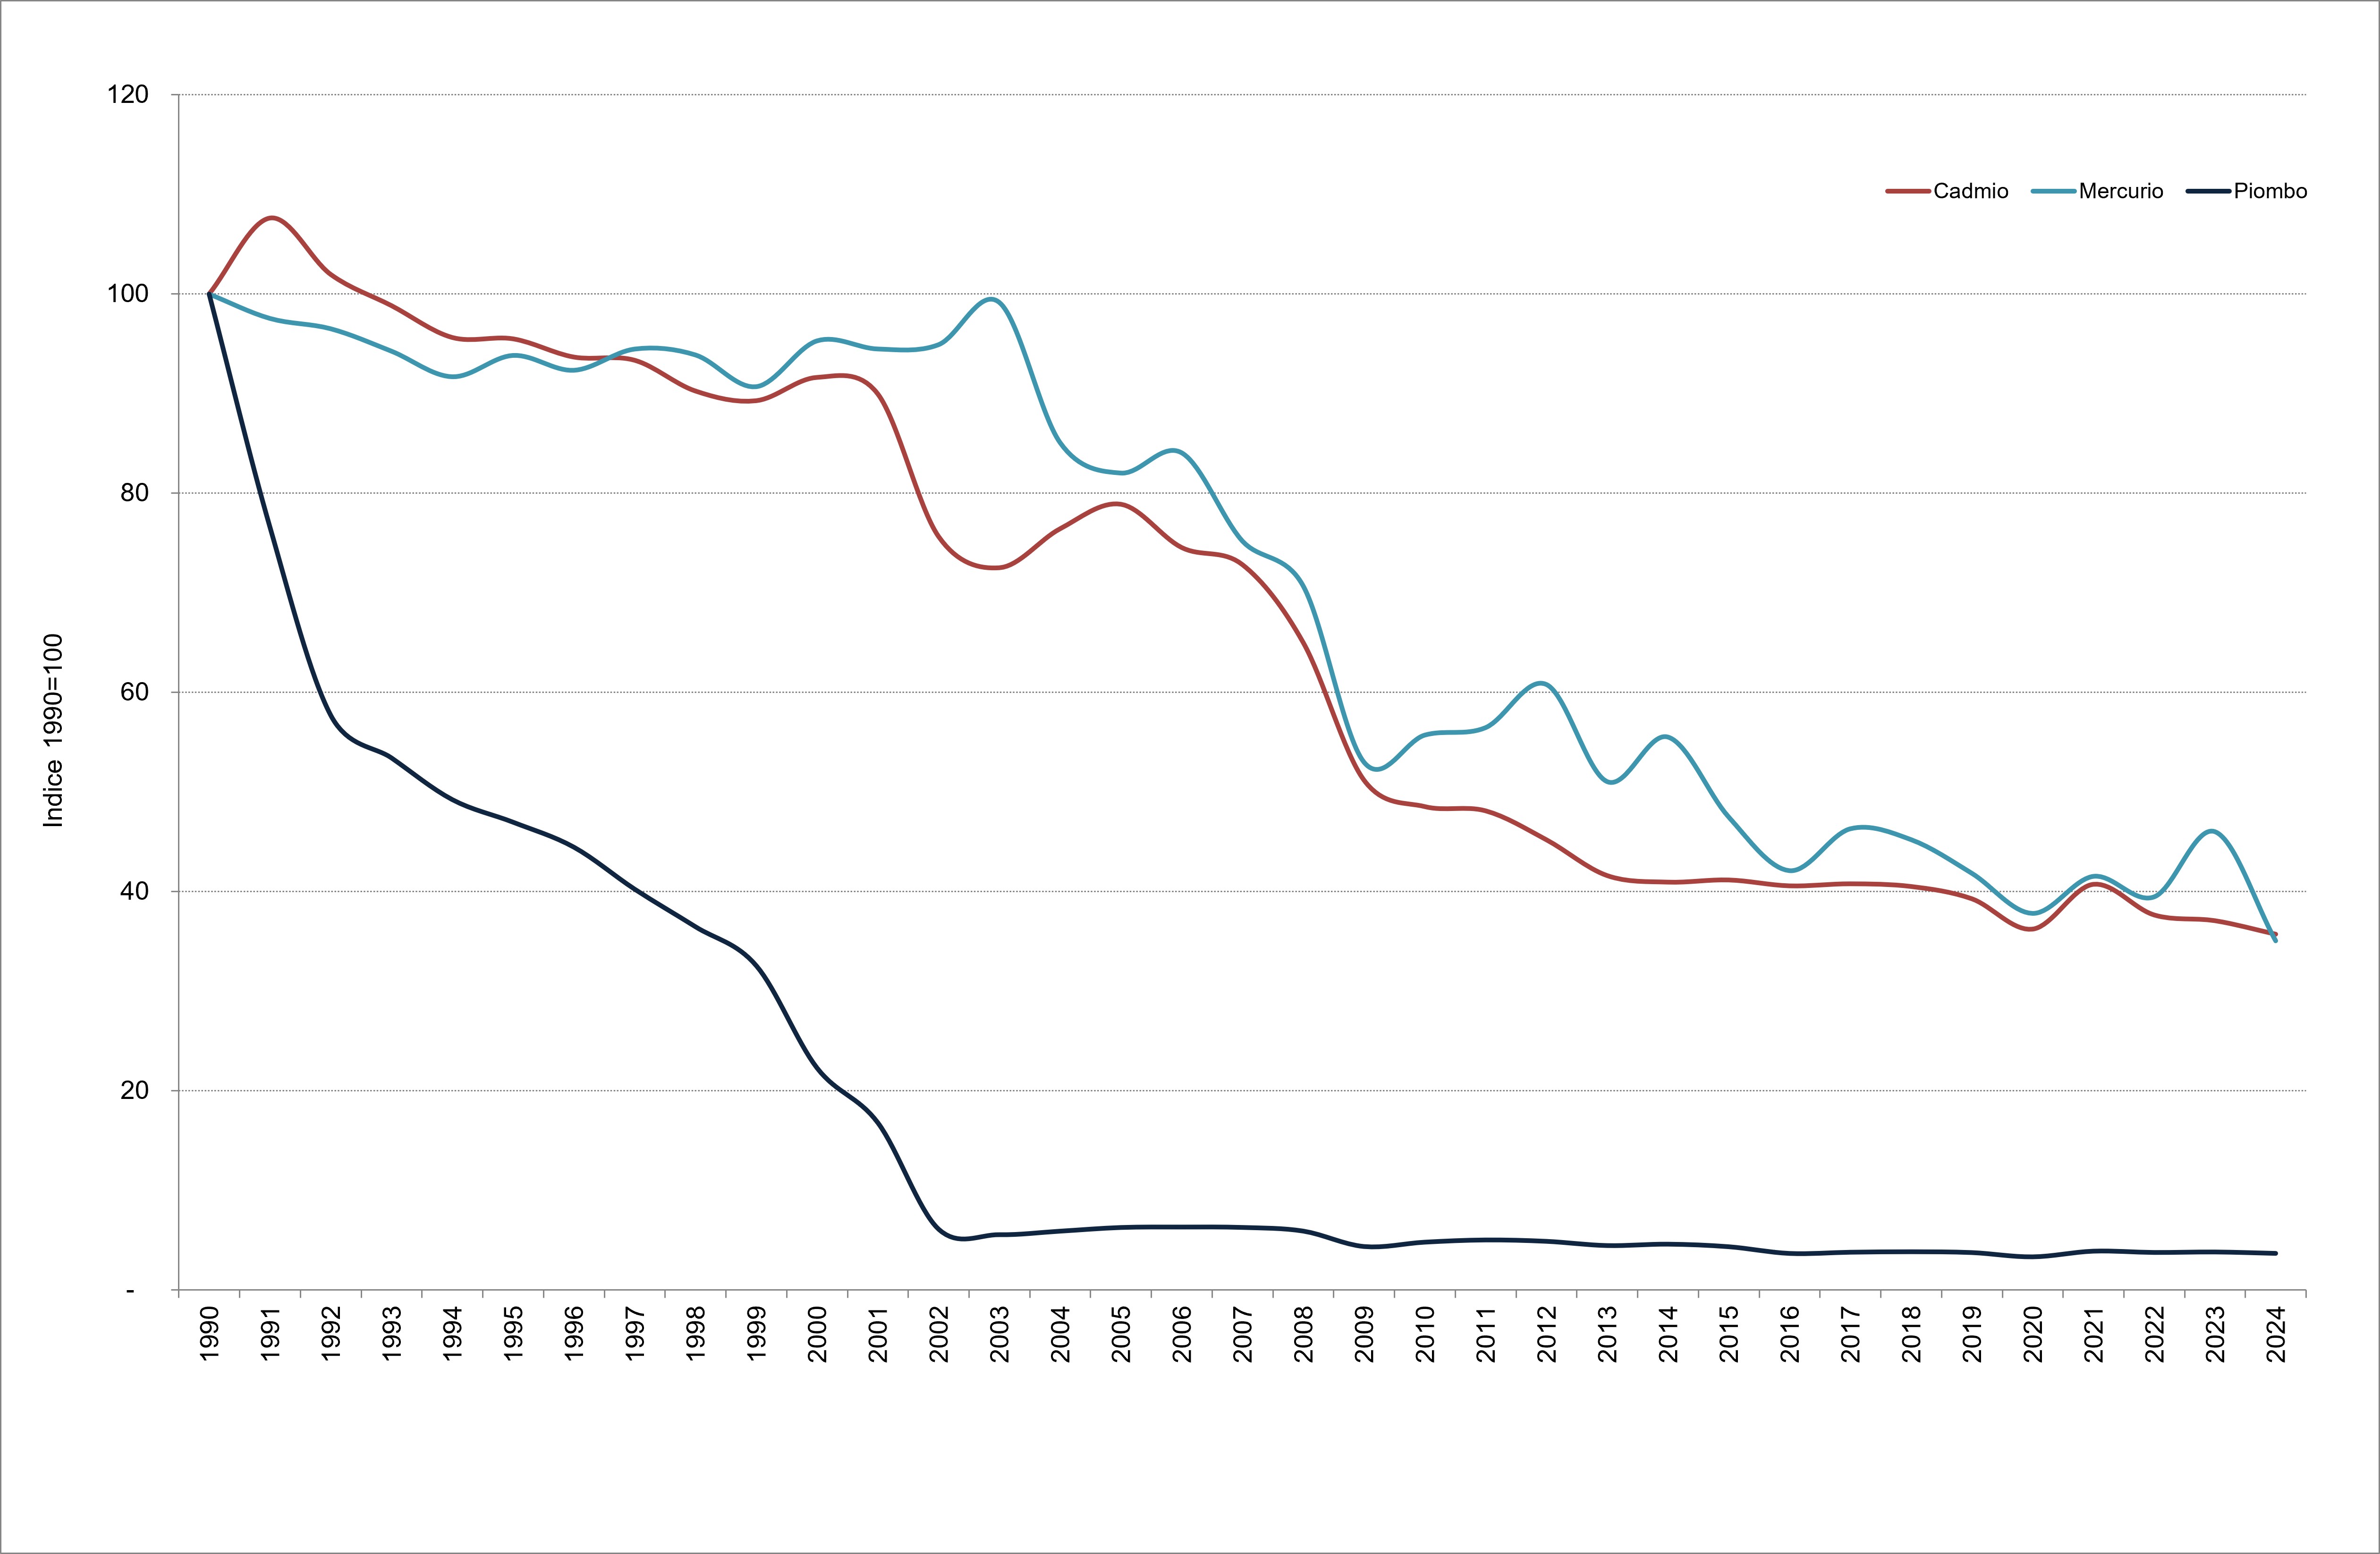
The indicator represents the historical series of national emissions of heavy metals from 1990 to 2024, by sector of origin. Since 1990 there has been a reduction in emissions for all metals. In particular, cadmium, mercury and lead emissions are in line with the objectives set at an international level by the Aarhus Protocol, having reduced compared to 1990 values by -64%, -65% and -96% respectively.
Heavy metal emissions derive largely from combustion, both industrial and non-industrial, from production processes and from the energy sector. Heavy metals have considerable health relevance as they persist in the environment giving rise to bioaccumulation phenomena and are also recognized as important carcinogenic agents, among these cadmium (Cd) falls into class 1 (certain carcinogens) of the International Agency for Research on Cancer.
The estimate of total national emissions of heavy metals disaggregated by sector of production activity allows us to evaluate the emission trend in the period in question and compare it with the objective set by the Aarhus Protocol.
The Aarhus Protocol on Heavy Metals (1998), within the Geneva Convention on Long-Range Transboundary Air Pollution (1979), indicates the reduction target for cadmium (Cd), mercury (Hg) and lead (Pb) as the value of emissions in 1990 (or alternatively every other year between 1985 and 1995).
ISPRA, 2026. Italian Emission Inventory 1990-2024. Information Inventory Report 2026
ISPRA
Used ISPRA data from the National Inventory of Atmospheric Emissions (https://emissioni. sina. isprambiente. it/interno-nazionale/).
National
1990-2024
Estimate made for the purposes of drawing up the national inventory of atmospheric emissions. For air pollutants the methodology used is that indicated by the European Environment Agency (EMEP/EEA Guidebook - 2023). For the description of the estimation methodology, reference is made to the Information Inventory Report – IIR (https://www. isprambiente. gov. it/it/pubblicazioni/rapporti; https://www. ceip. at/status-of-reporting-and-review-results/2026-submission)
Emissions of cadmium, mercury and lead are in line with the objectives set internationally, having reduced in 2024 compared to 1990 by 64%, 65% and 96% respectively. Objectives already achieved in 1993 for cadmium and in 1991 for mercury and lead (Table 1, Figure 1).
Decreasing trends are found for emissions of all three heavy metals (Table 1 and Figure 1), thus outlining a positive trend from an environmental point of view.
| Allegati |
|---|
Headline
Table 1: National emissions of heavy metals by sector Data source
ISPRA Data legend
A: Combustion – energy and transformation industry; B: Non-industrial combustion; C: Industrial combustion; D: Production processes; E: Extraction and distribution of fossil fuels/geothermal energy; F: Solvent use; G: Road transport; H: Other mobile sources; I: Waste treatment and disposal; L: Agriculture. Note
Emission values have been updated consistently with the annual update of the national emission inventory. |
Thumbnail
Headline
Figure 1: Trend of national emissions of heavy metals indexed to 1990 Data source
ISPRA Note
Emission values have been updated consistently with the annual update of the national emission inventory. |
Cadmium shows a decrease over the entire period 1990-2024 (-64%) mainly due to the reduction in emissions from industrial combustion (-80%), which in 2024 constitute 28% of the total (Table 1, Figure 1). The overall reduction in mercury emissions (-65%) comes mainly from industrial combustion (-74%) and production processes (-50%) (Table 1, Figure 1). The reduction in lead emission levels was notable (-96%), especially thanks to the use of green petrol; it should be noted, in fact, that the road transport sector, which contributed on average more than 84% to total lead emissions between 1990 and 1999, sees its weight decrease to an average value of around 21% in the period 2002-2024. Lead emissions linked to industrial combustion, despite having decreased by 88% since 1990, have, in 2024, an impact on total emissions of 19% (Table 1, Figure 1).