Marina Vitullo
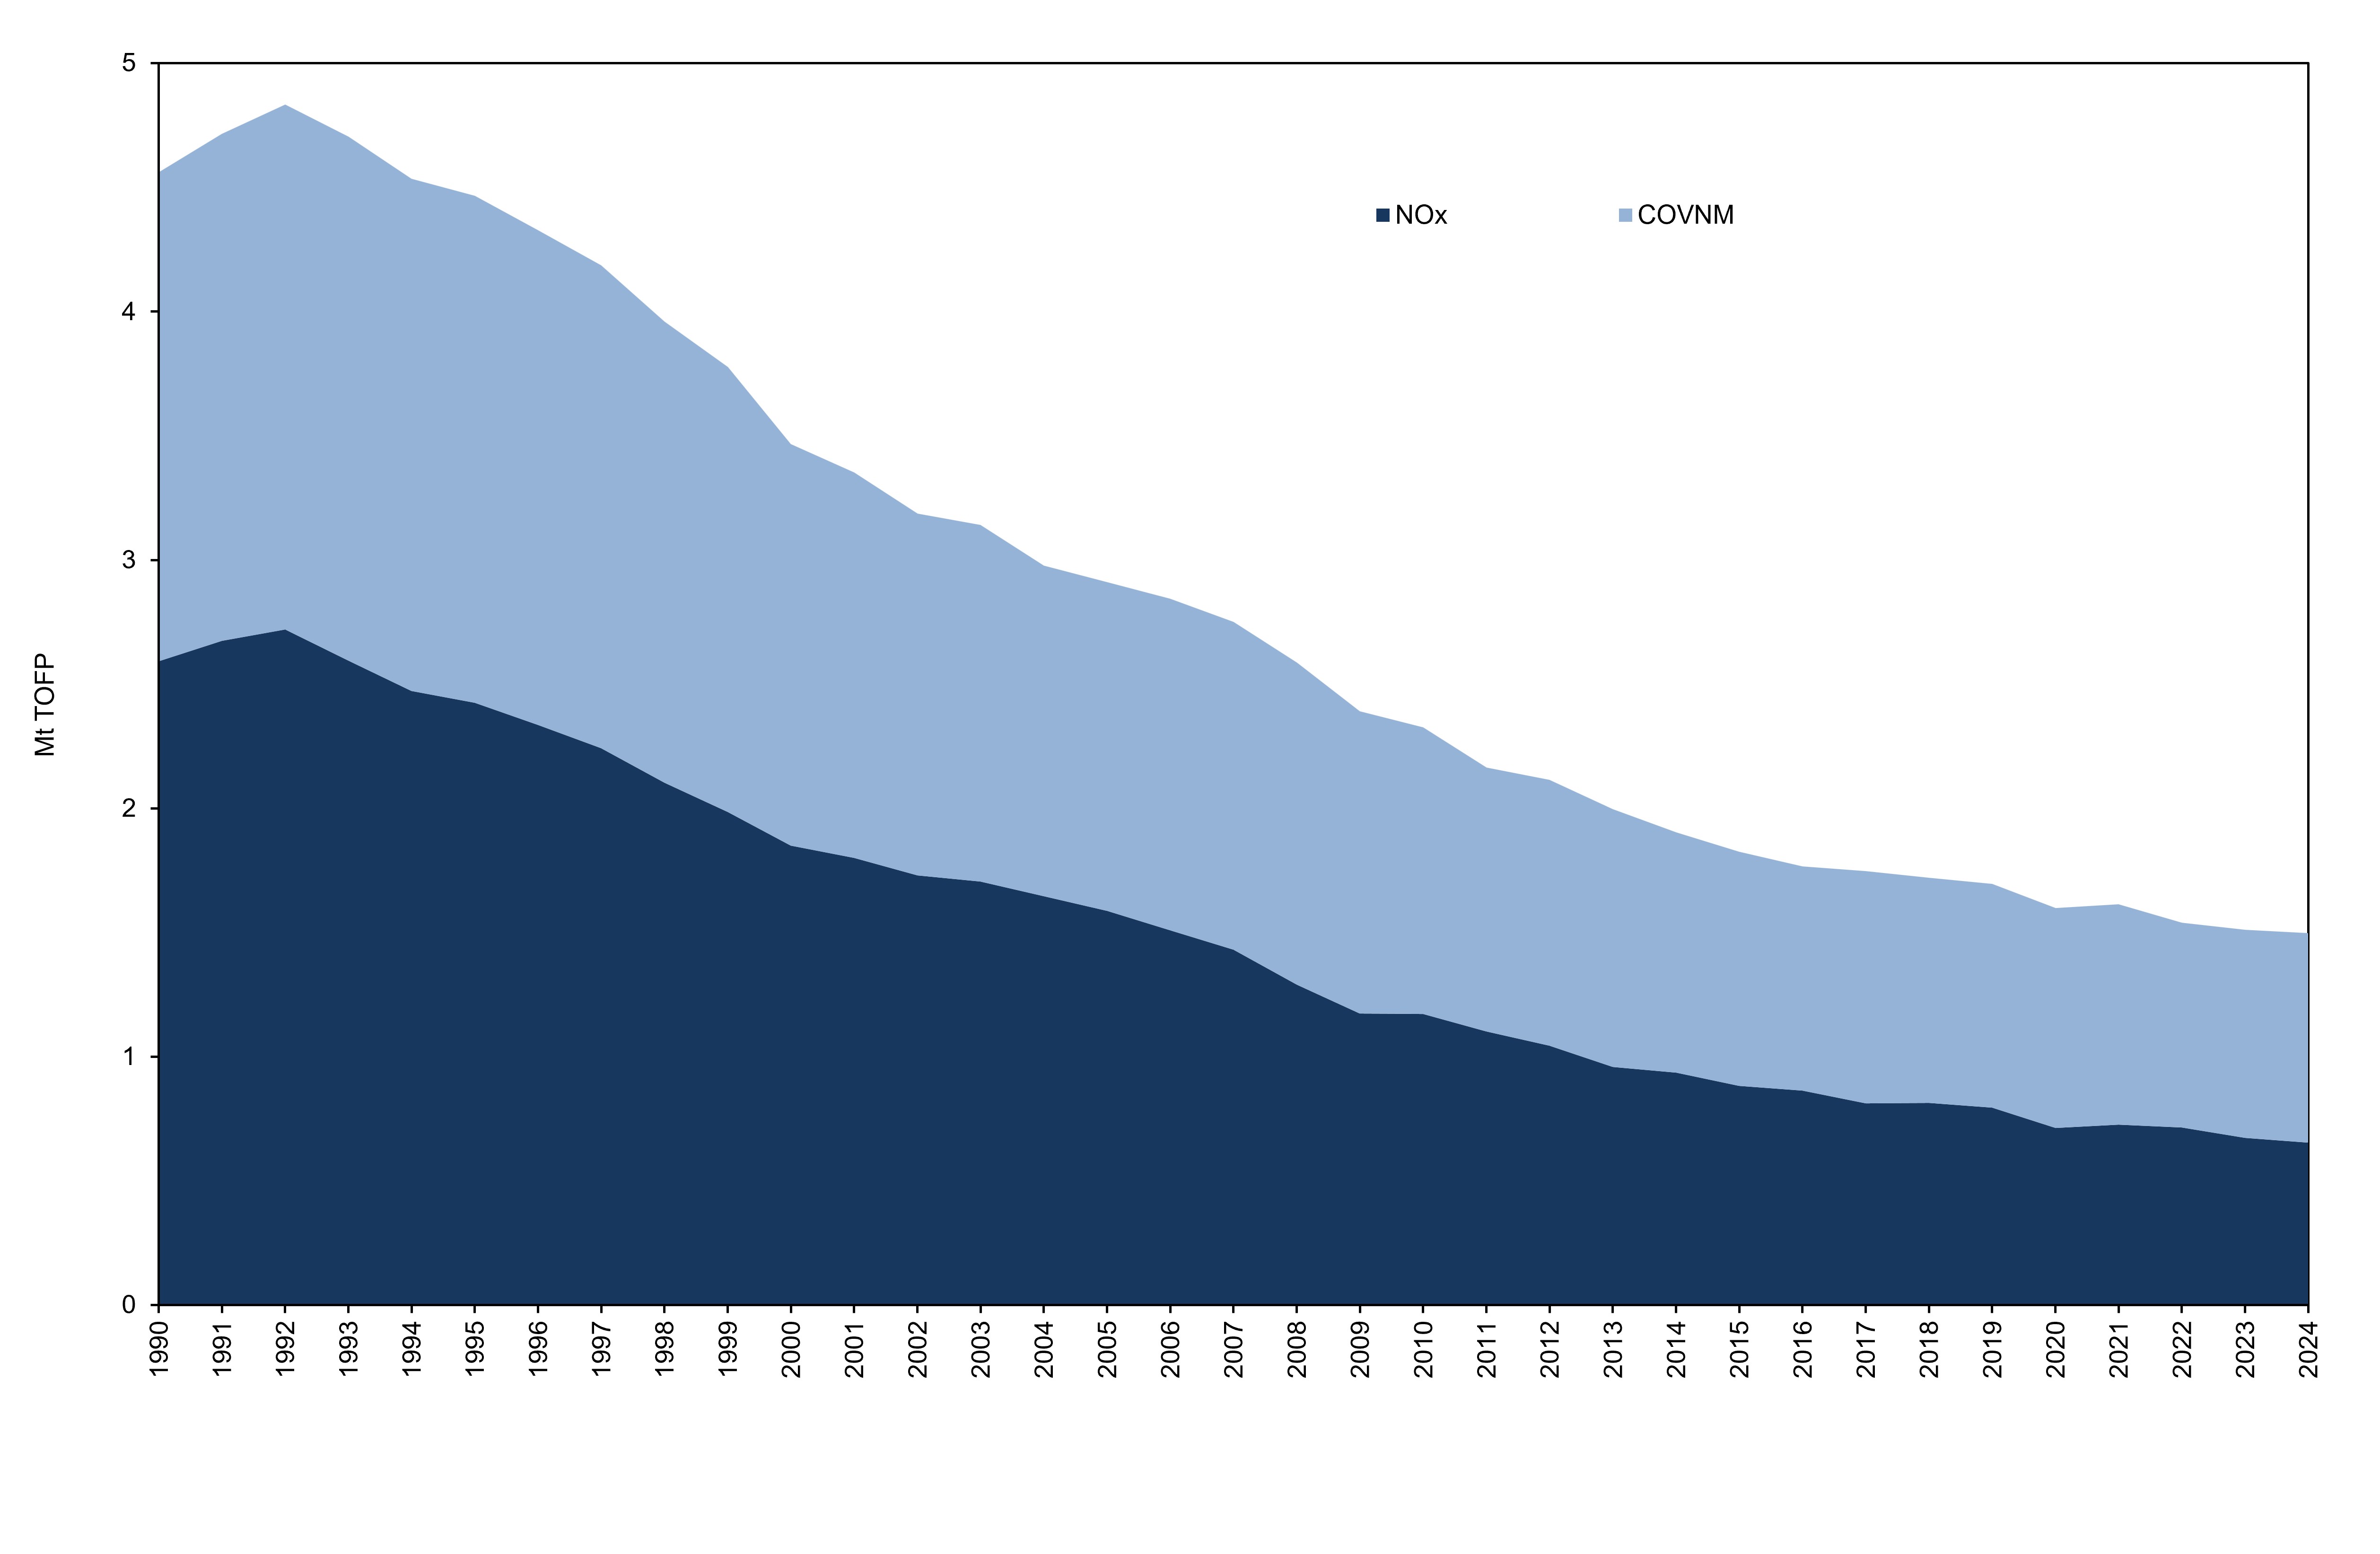
The indicator represents the national trend in the emission values of tropospheric ozone precursors: nitrogen oxides and non-methane volatile organic compounds, distinguished by sector of origin. The marked decrease from 1990 to 2024 is highlighted (-75% for NOx, and -57% for NMVOC), determined by the strong decrease in emissions deriving from transport.
Emissions are estimated according to the methodology indicated by the European Environment Agency (EMEP/EEA Air pollutant emission inventory guidebook 2023). The problem of tropospheric ozone is of considerable importance both in the urban environment, where acute episodes of pollution occur, and in the rural environment, where there is an impact on crops. Emissions of nitrogen oxides (NOx) and non-methane volatile organic compounds (NMVOCs), precursors of tropospheric ozone, also have cross-border relevance for long-distance transport phenomena. The formation of ozone occurs through photochemical reactions that occur in conjunction with weather conditions typical of the summer period. Ozone has a high oxidizing power and causes harmful effects on the population, on the ecosystem and on historical-artistic assets. The main sources of these pollutants are transport and other combustion processes, as well as the use of solvents with regard to NMVOCs.
Evaluate the pressures of tropospheric ozone precursors and their trend over the years in relation to national and international emission reduction objectives (Legislative Decree 171/04, Gothenburg Protocol and NEC Directive).
The 1999 Gothenburg Protocol to the 1979 Convention on Long-Range Transboundary Pollution, amended in 2012, is aimed at reducing acidification, eutrophication and ground-level ozone (the European Community adheres to the protocol with Council Decision 2003/507/EC). Directive (EU) 2015/2193 (implemented with Legislative Decree 183 of 2017) applies to medium combustion plants and establishes rules for the control of emissions of sulfur dioxide (SO2), nitrogen oxides (NOx) and dust into the air, in order to reduce emissions into the air and the potential risks to human health and the environment deriving from such emissions. The new NEC Directive 2016/2284 of the European Parliament and of the Council (implemented with Legislative Decree 81 of 2018), concerning the reduction of national emissions of certain air pollutants, defines the national emission reduction commitments compared to 2005, applicable from 2020 to 2029 and starting from 2030: for NOx respectively reduction commitments of 40% and 65%; for COVNM respectively reduction commitments of 35% and 46%.
ISPRA, 2026. Italian Emission Inventory 1990-2024. Informative Inventory Report 2026 (https://www. isprambiente. gov. it/it/pubblicazioni/rapporti/)
ISPRA
Used ISPRA data from the National Inventory of Atmospheric Emissions (https://emissioni. sina. isprambiente. it/interno-nazionale/).
National
1990 - 2024
Estimate made as part of the preparation of the national inventory of atmospheric emissions. Data can be aggregated using Tropospheric Ozone-Forming Potential (TOFP). These conversion factors are those used by the European Environment Agency in environmental reports and are especially useful for aggregate validation at European level. For air pollutants the methodology used is that indicated by the European Environment Agency (EMEP/EEA Guidebook - 2023). For the description of the estimation methodology, reference is made to the Information Inventory Report – IIR (https://www. isprambiente. gov. it/it/pubblicazioni/rapporti; https://www. ceip. at/status-of-reporting-and-review-results/2026-submission /).
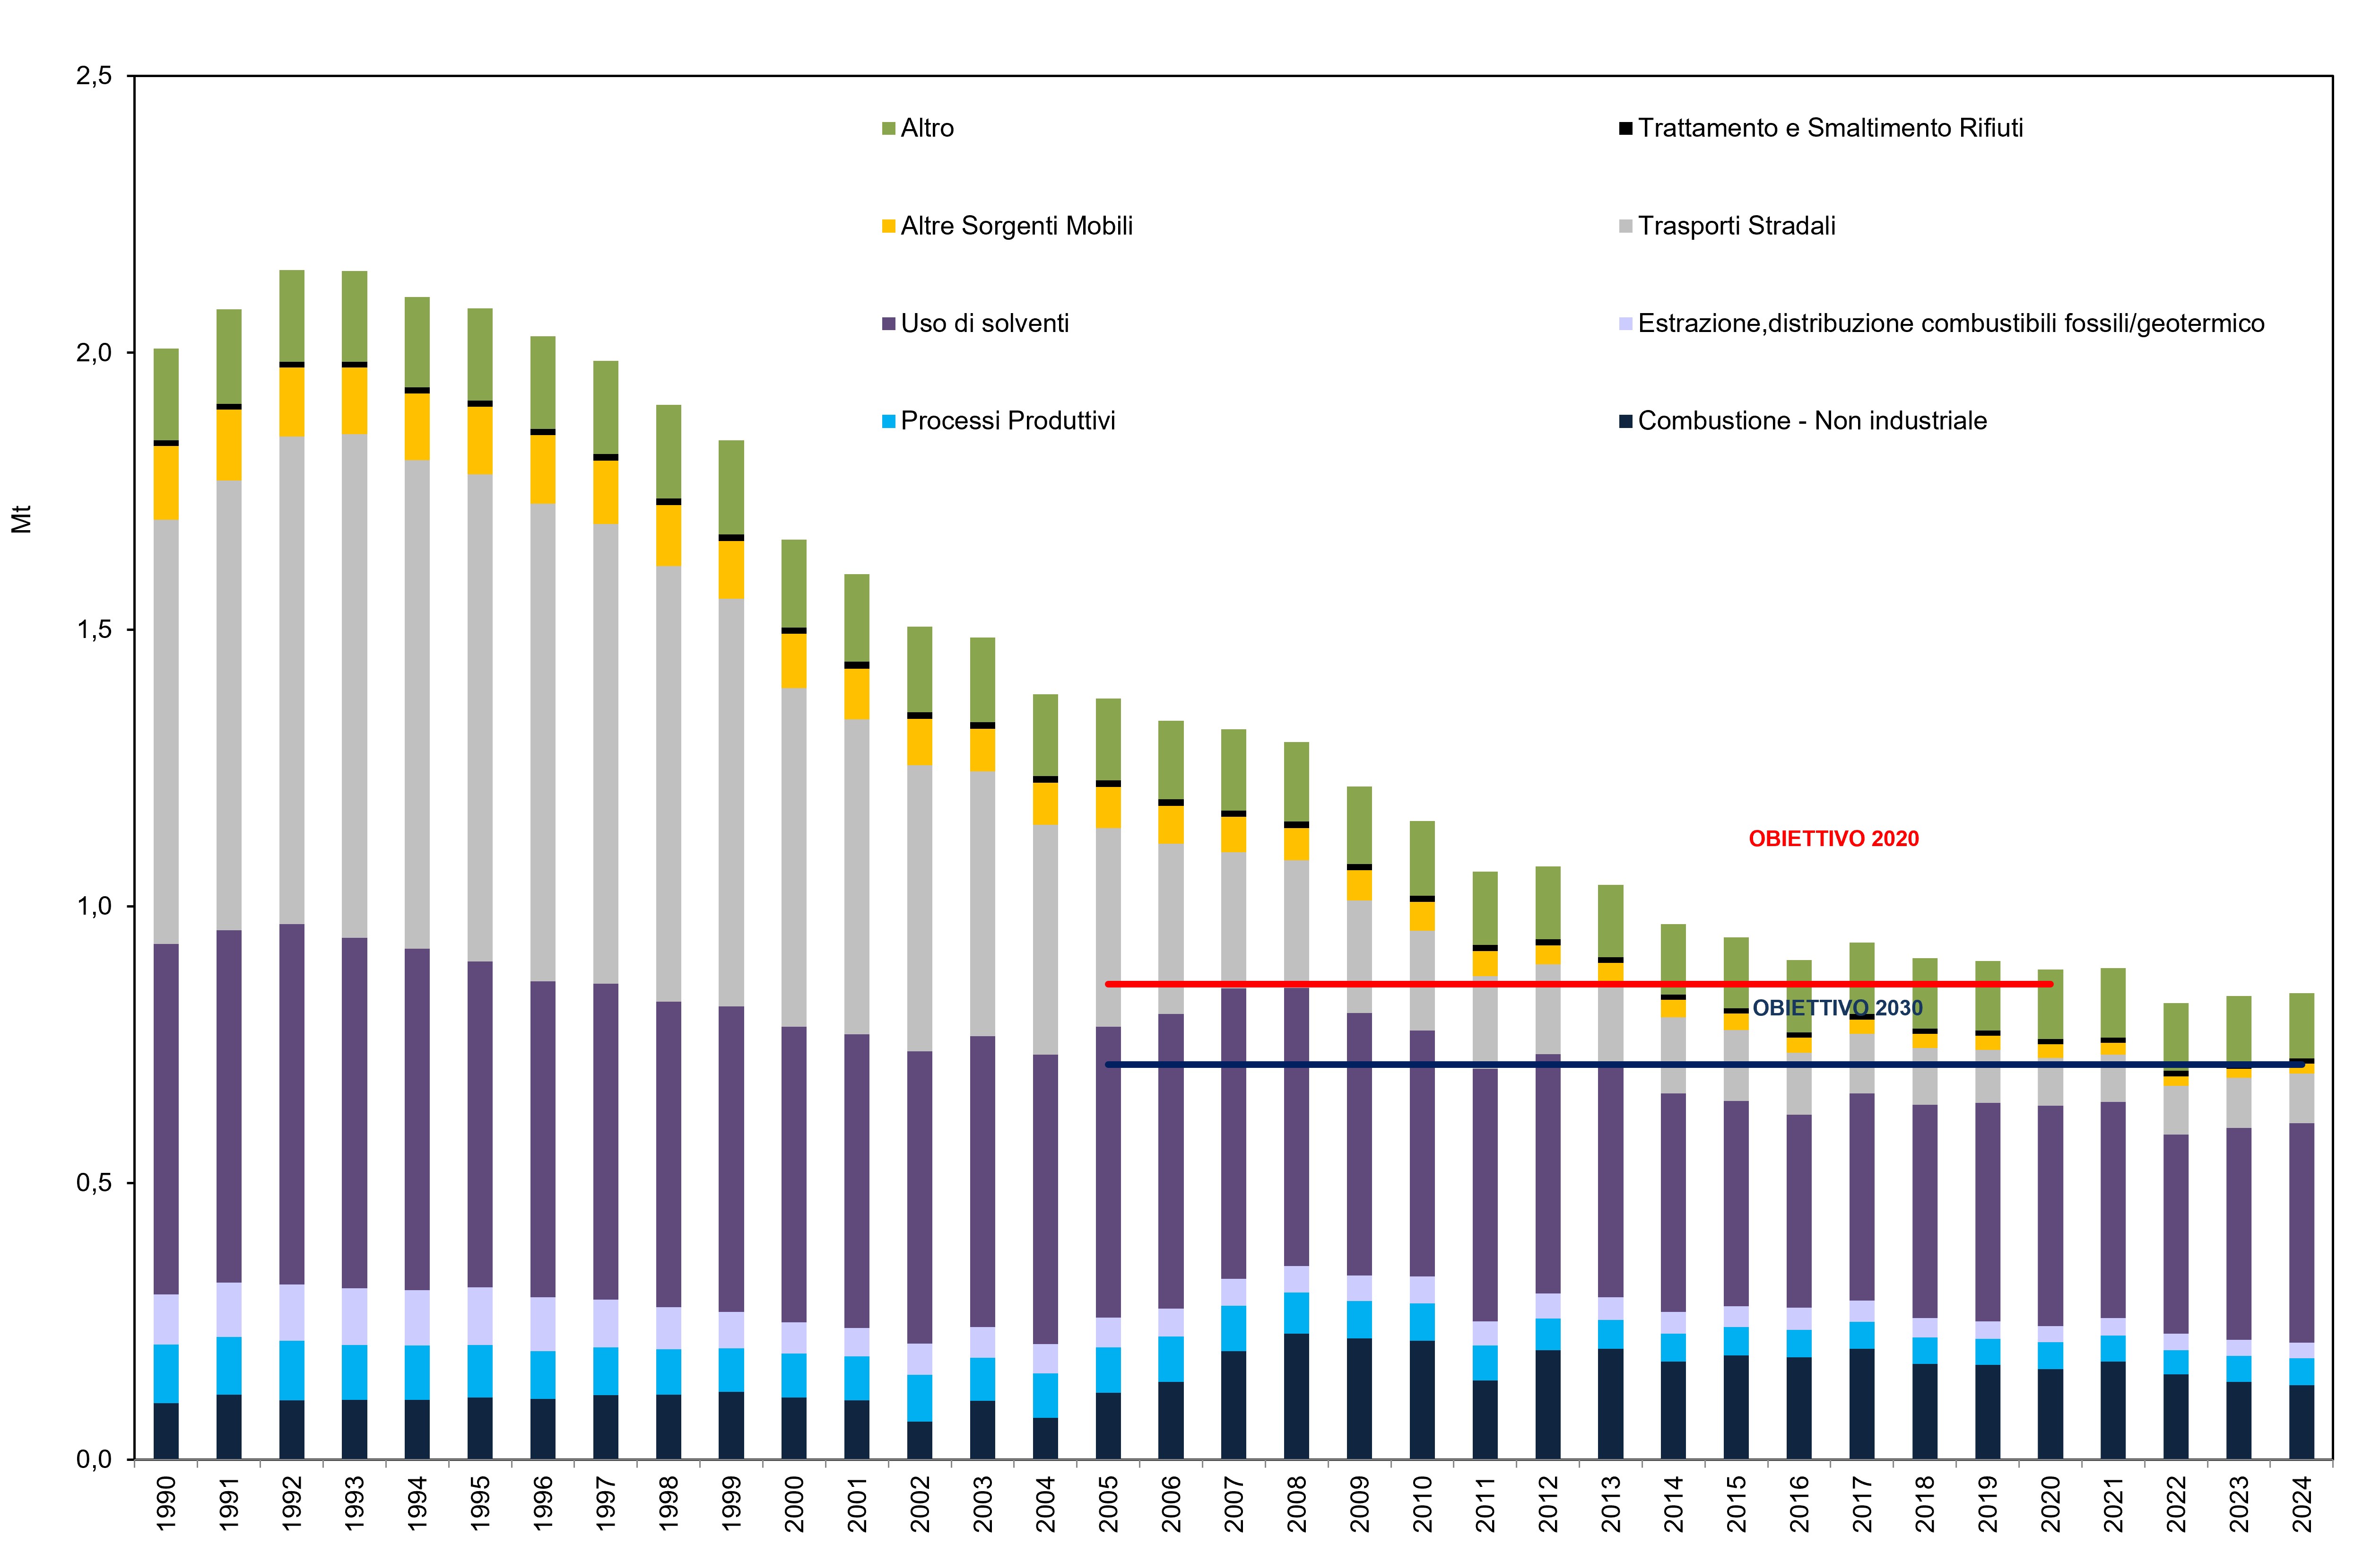
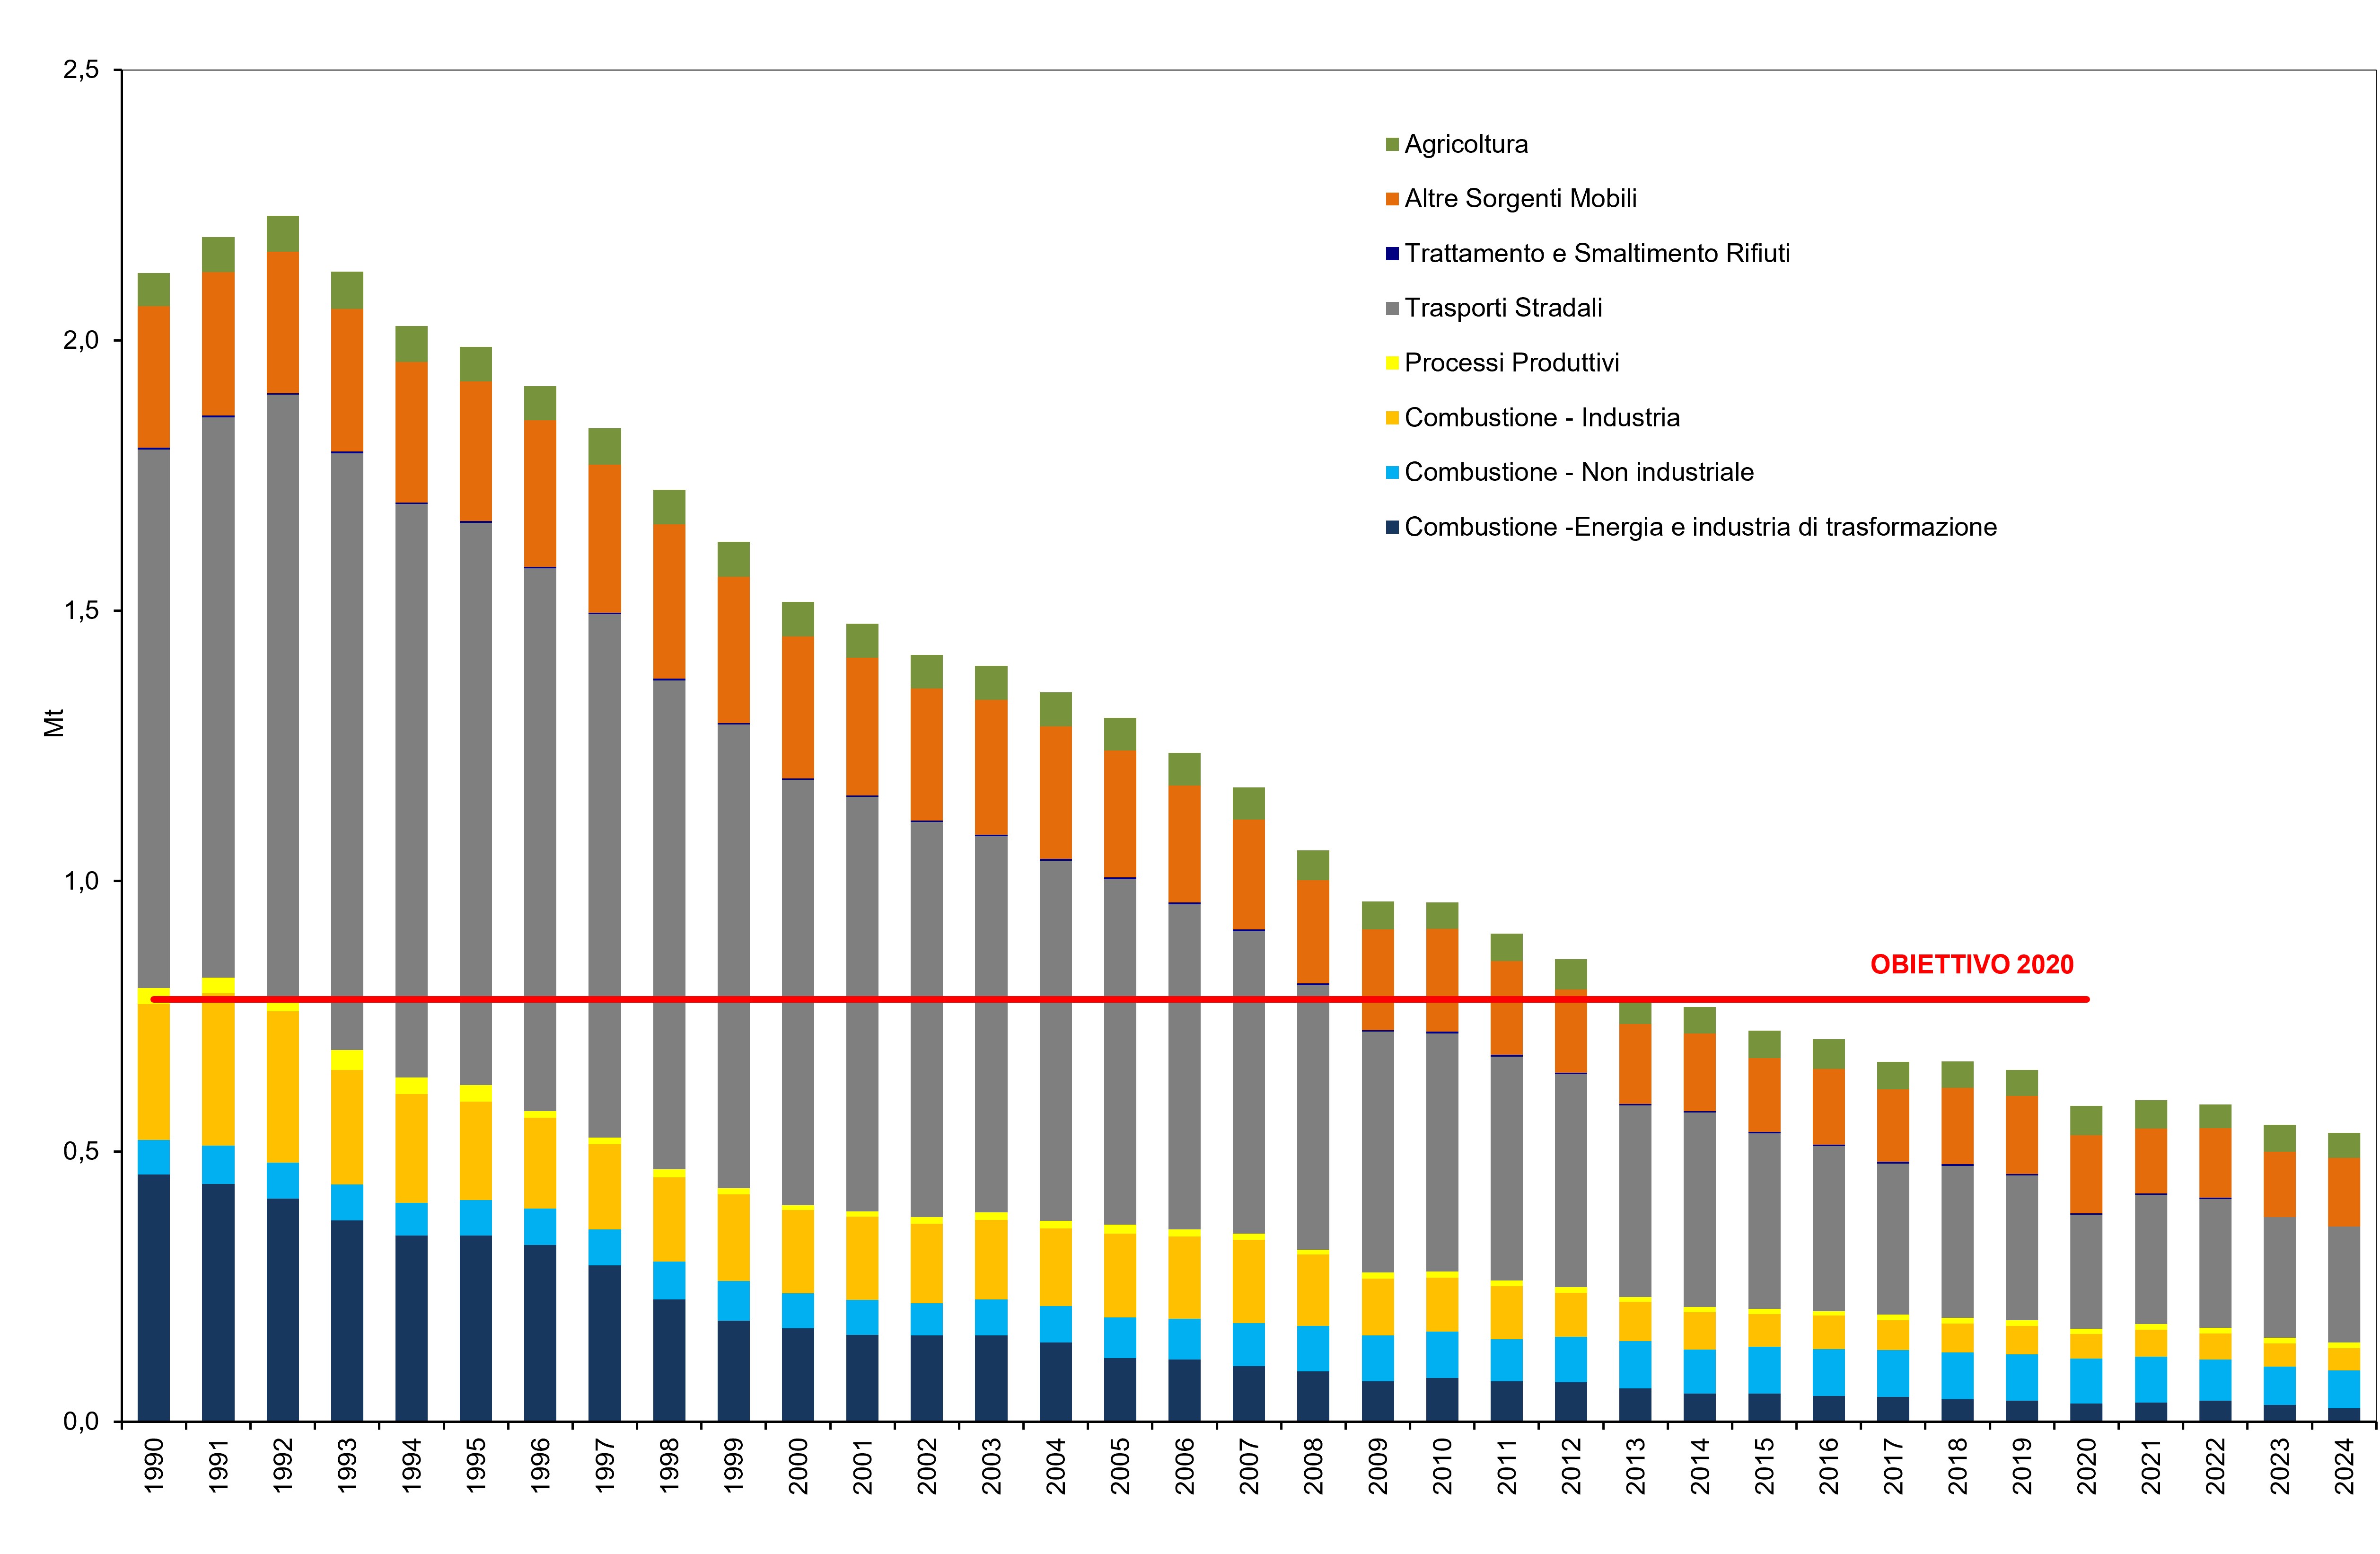
Emissions of nitrogen oxides are equal to 537 kt in 2024 while those of NMVOCs are equal to 843 kt. Nitrogen oxides reach the reduction percentage, imposed starting from 2020 by Directive 2016/2284 (-40%), already in 2013: in 2024, compared to the 2005 value, this reduction is equal to -58%. NMVOCs also reach the target (-35%) starting from 2022 with a decrease compared to 2005 of 38% confirmed also in 2024 with 36% (Table 1).
In the period 1990 -2024, emissions of tropospheric ozone precursors recorded a marked reduction (-75% for NOx, and -57% for NMVOCs), linked above all to the strong decrease in emissions in the two transport sectors (road transport and other mobile sources) and to the use of solvents (in particular for NMVOCs) (Tables 1,2 and Figure 3).
| Data |
|---|
Headline
Table 1: National emissions of ozone precursors by sector Data source
ISPRA Data legend
A: Combustion – Energy production and transformation industries Note
Emission values have been updated in line with the annual update of the national emission inventory. |
Headline
Table 2: National emissions of ozone precursors in tropospheric ozone formation potential Data source
ISPRA Data legend
TOFP conversion factor: NOx = 1.22; NMVOCs = 1 Note
Emission values have been updated in line with the annual update of the national emission inventory. |
Thumbnail
Headline
Figure 1: National NMVOC emissions by sector Data source
ISPRA Note
Emission values have been updated in line with the annual update of the national emission inventory. |
Thumbnail
Headline
Figure 2: National NOx emissions by sector Data source
ISPRA Note
Emission values have been updated in line with the annual update of the national emission inventory. |
Thumbnail
Headline
Figure 3: National emissions of ozone precursors in tropospheric ozone formation potential Data source
ISPRA Data legend
TOFP conversion factor: NOx = 1.22; NMVOCs = 1 Note
Emission values have been updated in line with the annual update of the national emission inventory. |
To guarantee consistency and comparability of the inventory, the annual update of emissions involves the continuous revision of the entire historical series on the basis of greater information and the most recent methodological developments. Emissions from natural sources (other emission sources and absorptions) are not counted in the totals, in accordance with the classification adopted in the estimate of emissions in the inventory. As regards nitrogen oxides, the emission contribution of road transport remains fairly stable over the years, and is the main source of NOx emissions at a national level (40% in 2024). Starting from 1993, basically as a result of the introduction of catalytic converters, the growing trend in road emissions reversed. In 2024, these emissions will reduce by 78.5% compared to 1990. NOx emissions from modes of transport other than road transport have decreased by 51.6% since 1990, and represent the second source of emissions at a national level, contributing to 23.6% of the total emissions in 2024. 13.1% of emissions come from non-industrial combustion, the only sector to show an increase (+9.4% since 1990), while 7.6% and 4.7% of the total emitted at a national level in 2024 come from industrial combustion and combustion in the energy production and transformation industry sectors respectively (Table 1, Figure 2). NMVOC emissions basically derive from: the use of solvents (47% of total emissions in 2024) which decreased by 37.4% compared to 1990; from non-industrial combustion (16% of emissions in 2024) which grows by 31.7% compared to 1990; from transport (road transport and other mobile sources represent 10.7% and 2.1% of total emissions in 2024 respectively); from agriculture, where there was a drop of 28%, which represents 12.9% of total emissions in 2024. The greatest reduction concerns transport, fundamentally due to the introduction of emission reduction systems in vehicles such as catalytic converters and canisters (respectively -88.3% for road transport and -88.6% for other mobile sources) (Table 1, Figure 1).