Piero Fraschetti, Francesca Lena, Walter Perconti, Emanuela Piervitali, Giulio Settanta
The indicator describes the trend in extreme heat events in Italy, specifically representing the number of days with a daily maximum air temperature exceeding 35 °C. In 2024, an increase of approximately 11.4 extremely hot days was observed compared to the climatological average for the 1991–2020 reference period.
The occurrence of extreme thermal events and the presence of significant trends are assessed through the analysis of absolute minimum and maximum air temperature values. Specifically, the indicator “very hot days”, as defined by the Expert Team on Sector-Specific Climate Indices (ET-SCI), represents the number of days when the daily maximum air temperature exceeds 35 °C.
The annual time series of the average number of hot days, expressed as the deviation from a climatological baseline, allows for the estimation of the frequency of extreme heat events and the evaluation of significant trends over time.
The indicator is not directly linked to any regulatory or legislative framework.
https://scia.isprambiente.it;
APAT-OMS, 2007, Cambiamenti climatici ed eventi estremi: rischi per la salute in Italia, Rapporti 77/2007
ISPRA, 2022, I normali climatici 1991-2020 di temperatura e precipitazione in Italia; Stato dell'Ambiente 99/2022
ISPRA, 2018, Variazioni della temperatura in Italia: estensione della base dati e aggiornamento della metodologia di calcolo; Stato dell’ambiente 81/2018;
ISPRA, 2016, Controlli di qualità delle serie di temperatura e precipitazione; Stato dell'Ambiente 66/2016
ISPRA, 2015, Valori climatici normali di temperatura e precipitazione in Italia; Stato dell'Ambiente 55/2015
ISPRA, 2014, Focus su "Le città e la sfida ai cambiamenti climatici"; Stato dell'Ambiente 54/2014
ISPRA, 2013, Variazioni e tendenze degli estremi di temperatura e precipitazione in Italia; Stato dell'Ambiente 37/2013
ISPRA, 2012, Elaborazione delle serie temporali per la stima delle tendenze climatiche; Stato dell'Ambiente 32/2012
Peterson T.C ., Folland C , Gruza G, Hogg W, Mokssit A e Plummer N., 2001, Report on the activities of the Working Group on Climate Change Detection and Related Rapporteurs 1998-2001. World Meteorological Organization, Rep. WC DMP-47, WMO -TD 1071, Geneva, Switzerland, 143 pp.;
SNPA, 2025, Il clima in Italia nel 2024; Report ambientali SNPA n. 44/2025
Toreti A. e Desiato F., 2007, Changes in temperature extremes over Italy in the last 44 years, Int. J. Climatology, DO I 10.1002/joc.1576.
Improvements in the estimation of hot days in Italy could result from the extension of the indicator calculation system to include additional sources of raw temperature data, with the aim of increasing the availability of long-term temperature time series that meet requirements of duration, continuity, and completeness.
ISPRA
SCIA – Sistema nazionale per l’elaborazione e diffusione di dati climatici (https://scia.isprambiente.it)
Italy
1961-2024
To determine whether a specific calendar day qualifies as a “very hot day”, the daily maximum air temperature is compared with the threshold of 35°C. Therefore, validated daily maximum temperature data must be available. The SCIA system (National System for the Processing and Dissemination of Climate Data) processes raw meteorological data and produces a daily maximum temperature value, which is accepted as valid only if it passes specific quality control procedures. If the daily maximum temperature is validated, it is compared with the 35°C threshold to determine whether the day can be classified as a very hot day. The annual indicator value is calculated by summing the number of very hot days recorded in a given year. This value is considered valid only if at least 75% of the daily data are available and validated for the year in question. The climatological baseline used for anomaly calculation has been updated to the most recent 30-year reference period, 1991–2020. This choice follows the latest guidance from the World Meteorological Organization (WMO), which recommends updating climatological baselines every ten years for operational climatology purposes.
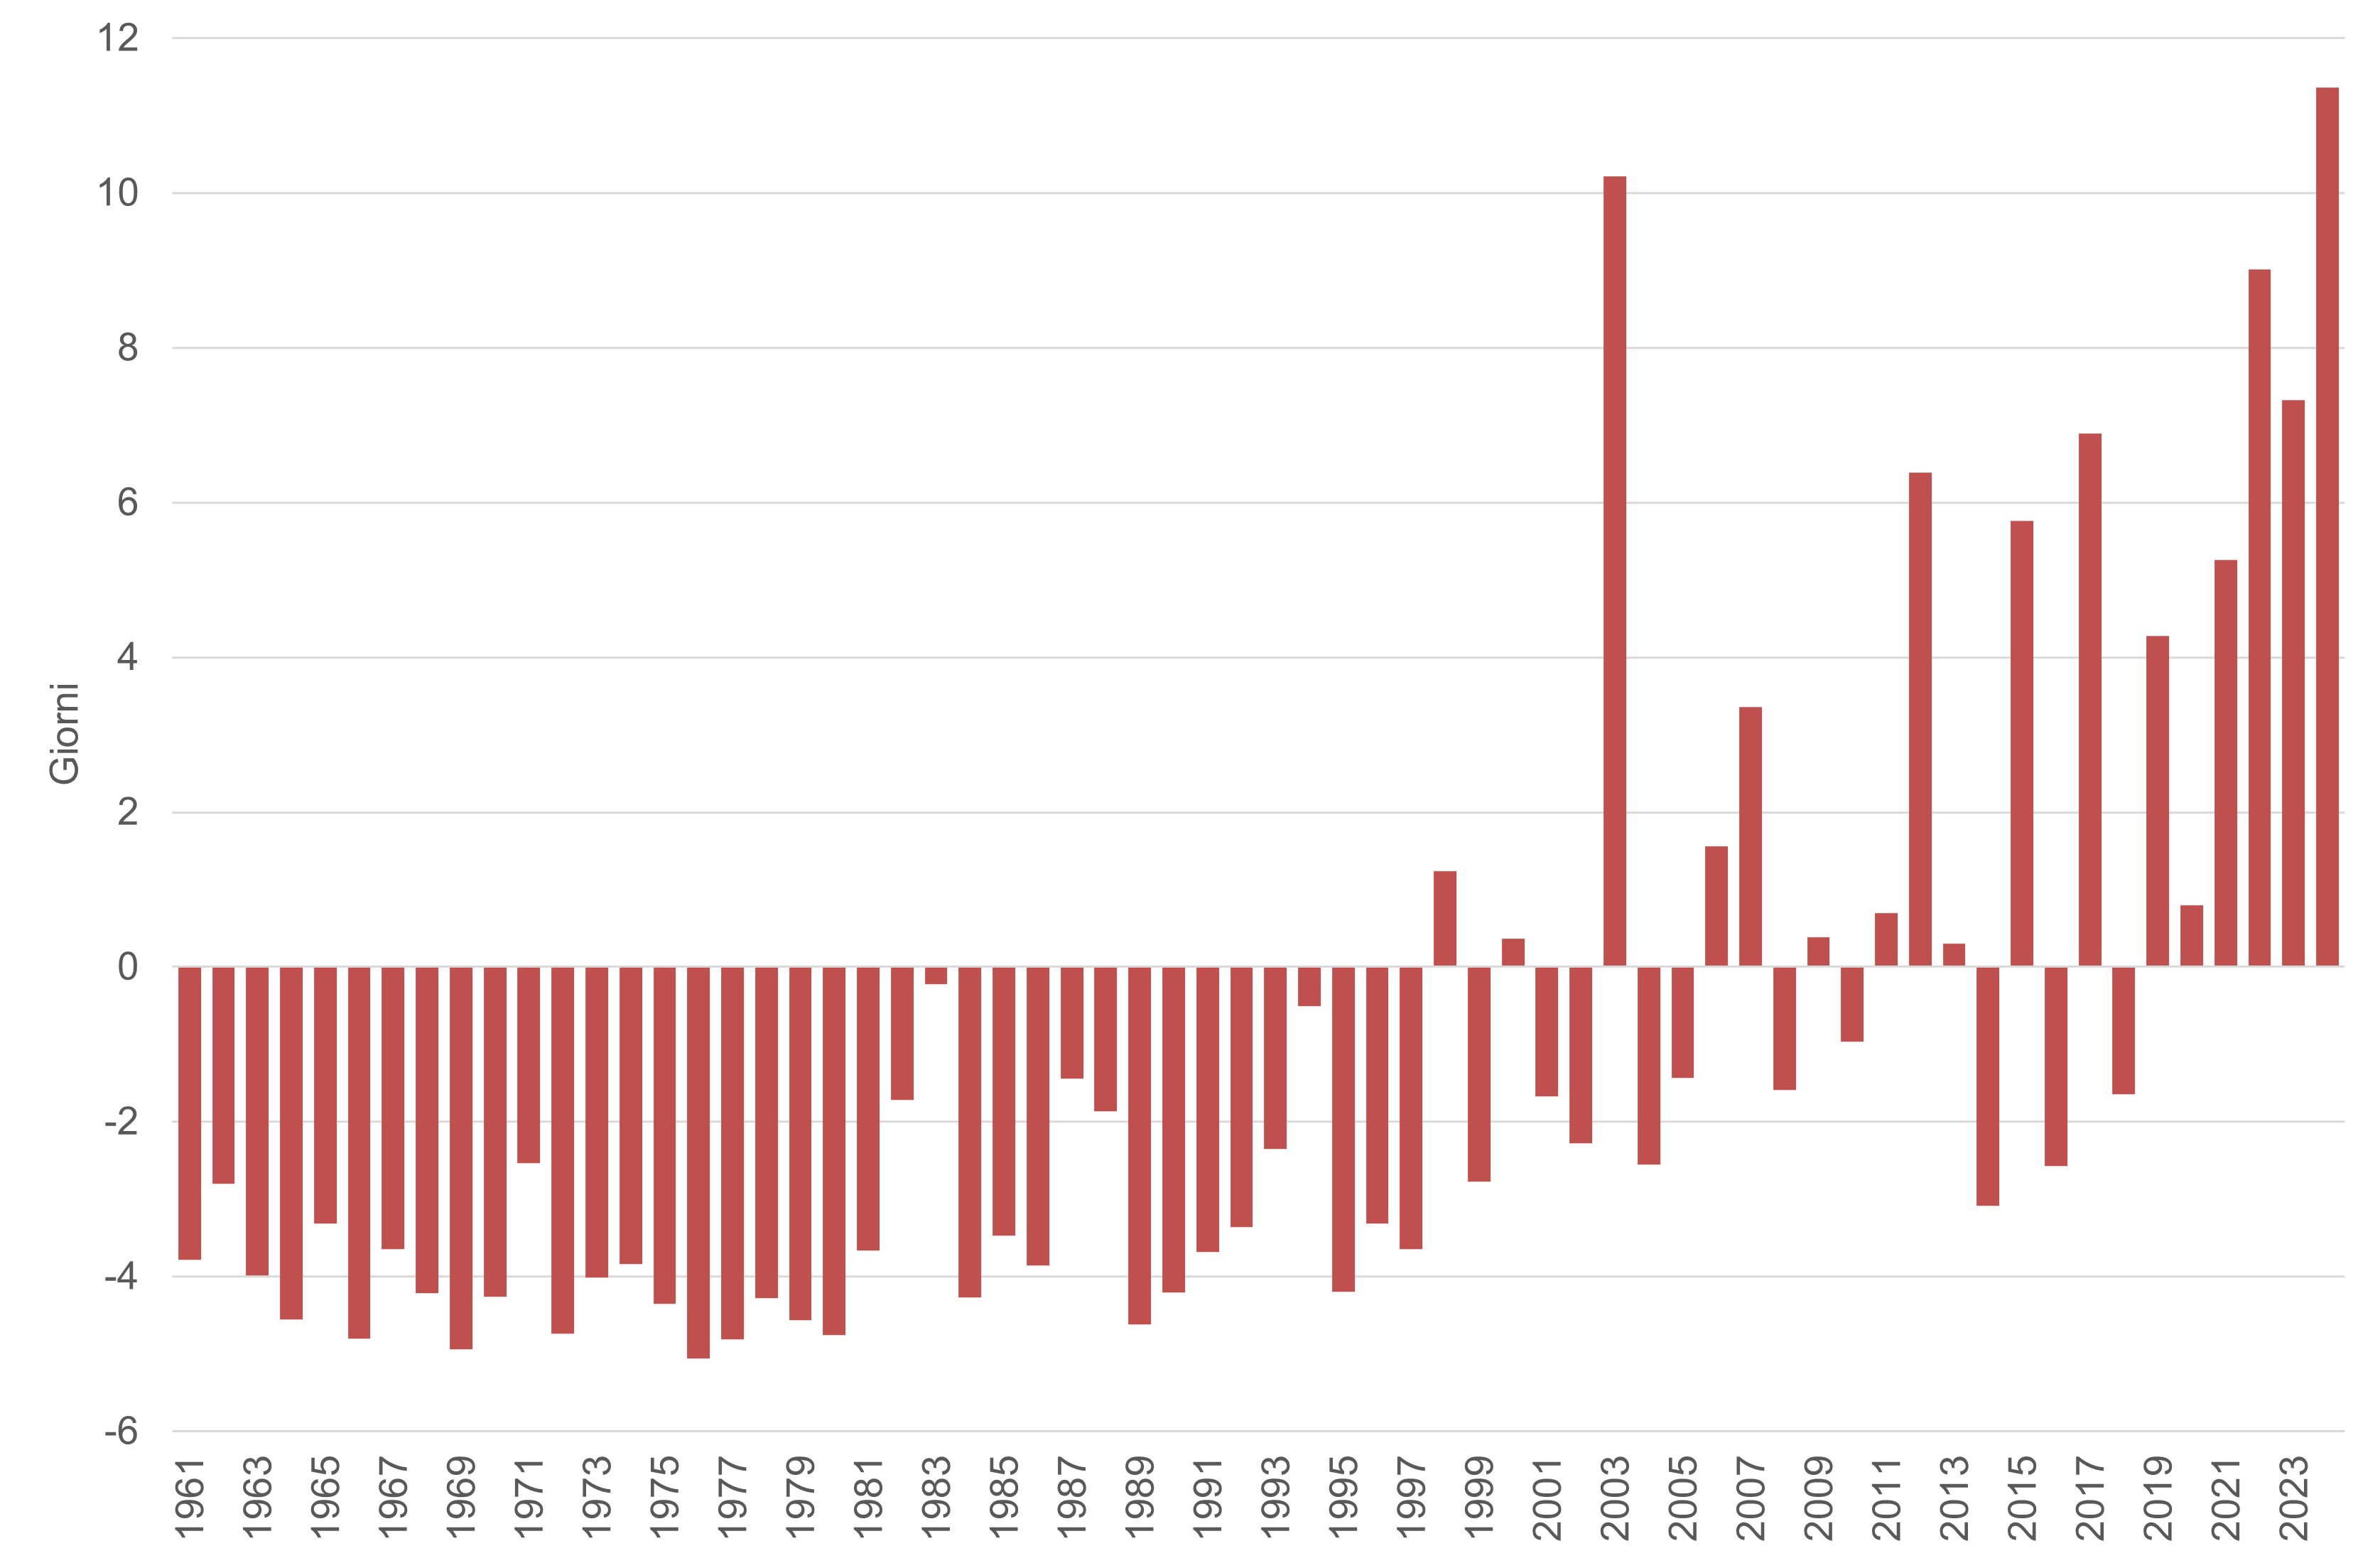
In 2024, an increase of approximately 11.4 hot days was observed compared to the average value calculated for the reference thirty-year period (1991-2020).
Over the last 10 years, the number of hot days has consistently been higher than the reference thirty-year period (1991-2020), except for 2016, and 2018. Given that the main international climate change strategies and policies aim to combat the ongoing warming of the climate system, the evaluation of an unfavorable trend and the assignment of the corresponding icon can be interpreted in terms of deviation from this goal.
| Allegati |
|---|
Thumbnail
Titolo
Figure 1: Time series of the annual mean anomalies of the number of hot days in Italy compared to the reference value 1991-2020. Fonte
ISPRA |
The time series of annual average anomalies for the number of hot days in Italy indicates that 2024, with an increase of approximately 11.4 days compared to the average value calculated for the reference thirty-year period (1991-2020), ranks firts among the highest in the entire time series (Figure 1).