Giorgio Cattani, Mariacarmela Cusano, Alessandro Di Menno di Bucchianico, Raffaela Gaddi, Alessandra Gaeta, Giuseppe Gandolfo, Gianluca Leone
The indicator is based on nitrogen dioxide (NO) concentration data 2) in the atmosphere measured during 2024 in monitoring stations distributed across the national territory, collected and archived by ISPRA in databases InfoAria, in accordance with the provisions of Directive 2008/50/EC (and the legislative decree transposing Legislative Decree 155/2010) and Decision 2011/850/EU. The monitoring stations that measured and reported NO 2 there are 625, of which 605 have data series with sufficient time coverage to verify the reference values. The hourly limit value is respected everywhere: in no station has 200 µg/m³, as an hourly average, been exceeded more than 18 times. The WHO reference value, which does not foresee exceeding 200 µg/m³, is exceeded in 5 stations (equal to 0.83% of stations with sufficient temporal coverage). The annual limit value, equal to 40 µg/m³ as an annual average, is exceeded in 10 stations (1.7%). The WHO reference value for long-term effects on human health, equal to 10 µg/m³ as an annual average, is exceeded in 444 stations (73.4%).
Nitrogen dioxide (NO 2) is a reddish-brown gas, slightly soluble in water, toxic, with a strong, pungent odor and strong irritant power. It is a pollutant with a predominantly secondary component, as it is the product of the oxidation of nitrogen monoxide (NO) in the atmosphere; only in a smaller proportion is it emitted directly into the atmosphere. The main source of nitrogen oxide emissions (NOx=NO+ NO 2) is vehicular traffic; other sources are civil and industrial heating systems, energy production plants and a wide spectrum of industrial processes. Nitrogen dioxide is a widely spread pollutant that has negative effects on human health and together with nitrogen monoxide contributes to the phenomena of smog photochemical (it is a precursor for the formation of secondary pollutants such as tropospheric ozone and secondary fine particulate matter) of eutrophication and acid rain. The indicator was developed based on NO concentration data 2 in the atmosphere, measured in monitoring stations distributed throughout the national territory, collected and archived in ISPRA, in databases InfoAria in accordance with the provisions of Decision 2011/850/EU. In addition to the parameters for comparison with the limit values for the protection of human health established by the reference legislation (Legislative Decree 155/2010) and with the reference values for the protection of human health established by the WHO (WHO-AQG, 2021), the order percentiles were calculated: 5th, 25th, 50th, 75th, 95th, 98.8th and maximum of the hourly average values.
Provide information on the state of air quality through the statistical parameters calculated from the concentration data of nitrogen dioxide in ambient air, the verification of compliance with the limit values established by the legislation and the comparison with the reference values established by the WHO.
- Directive 2008/50/EC of the European Parliament and of the Council of 21 May 2008 on ambient air quality and cleaner air for Europe.
- Legislative Decree 155/2010: Legislative Decree 13 August 2010, n. 155 Implementation of Directive 2008/50/EC relating to ambient air quality and cleaner air in Europe (Official Gazette, no. 216 of 09/15/2010 – ord. Suppl. No. 217 – in force from 09/30/2010).
- Decision 2011/850/EU – Commission Implementing Decision laying down rules for Directive 2004/107/EC and Directive 2088/50/EC of the European Parliament and of the Council as regards the reciprocal exchange of information and reporting on ambient air quality.
The objective of Directive 2008/50/EC is to allow the assessment of ambient air quality on a common basis, to obtain information on the state of air quality in order to combat air pollution, to ensure the public availability of information and to promote cooperation between Member States.
Legislative Decree 155/2010, which implements the aforementioned directive at a national level, also has the objective of allowing autonomous regions and provinces to evaluate and manage ambient air quality. The limit values of Legislative Decree 155/2010 represent the ambient air quality objectives to be pursued to avoid, prevent and reduce harmful effects on human health and the environment. The WHO reference values represent a guide to follow in reducing the impact of air pollution on human health.
The limit values for nitrogen dioxide in ambient air set by Legislative Decree 155/2010 are as follows:
• for the one-hour averaging period the limit value is 200 µg/m 3 not to exceed more than 18 times per calendar year;
• for the averaging period of one calendar year the limit value is 40 µg/m³.
While, the WHO reference values for nitrogen dioxide in ambient air indicated in WHO global air quality guidelines 2021 are as follows:
• for the one-hour averaging period the guide value is 200 µg/m³ not to be exceeded in the calendar year;
• for the averaging period of one calendar year the guideline value is 10 µg/m³.
ISPRA. Environmental data yearbook, various years
SNPA. (2024). Air quality in Italy. 2023 edition. SNPA system report 40/2024.
World Health Organization. (2021). Global air quality guidelines: Particulate matter (PM2.5 and PM10), ozone, nitrogen dioxide, sulfur dioxide and carbon monoxide . Geneva: WHO.
Autonomous Provinces
Regions
SNPA (National System for Environmental Protection)
ISPRA, Databases InfoAria
National;
Regional: (20/20);
Provincial (104/110);
Municipal (418/8047);
2015-2024
The indicator is based on the concentration data of nitrogen dioxide in the atmosphere, measured in monitoring stations distributed throughout the national territory, collected and archived by ISPRA, in the InfoAria database in accordance with the provisions of Decision 2011/850/EU. The parameters were calculated for a comparison with the limit values for the protection of human health established by the reference legislation (Legislative Decree 155/2010) and with the reference values established by the WHO for the protection of human health. All parameters are calculated according to European rules and have been verified by the SNPA. For the comparison with the hourly and annual limit values of Legislative Decree 155/2010 and with the WHO reference values (both shown in Figures 2 and 3), data series with a minimum time coverage of 90% were used (net of data losses due to periodic calibration or ordinary maintenance).
The statistical analysis of trend (2015-2024) was conducted with the seasonally corrected Mann-Kendall method. Implementing a deseasonalization method allows us to minimize the effect of interannual oscillations due to the differences found in the various years compared to the average seasonal cycle, to highlight the existence of an underlying trend, to quantify its statistical significance and to estimate the variation in average annual concentration in the observation period.
The hourly limit value is respected everywhere: in no station has 200 µg/m³, as an hourly average, been exceeded more than 18 times. The WHO reference value, which does not foresee exceeding 200 µg/m³, is exceeded in 5 stations (equal to 0.83% of the stations with sufficient temporal coverage, Table 1 and Figure 2). The annual limit value, equal to 40 µg/m³ as an annual average, is exceeded in 10 stations (1.7%). The WHO reference value for long-term effects on human health, equal to 10 µg/m³ as an annual average, is exceeded in 444 stations (73.4 %; Table 1 and Figure 3).
Almost all of the exceedances were recorded in traffic-oriented stations, located in important urban areas.
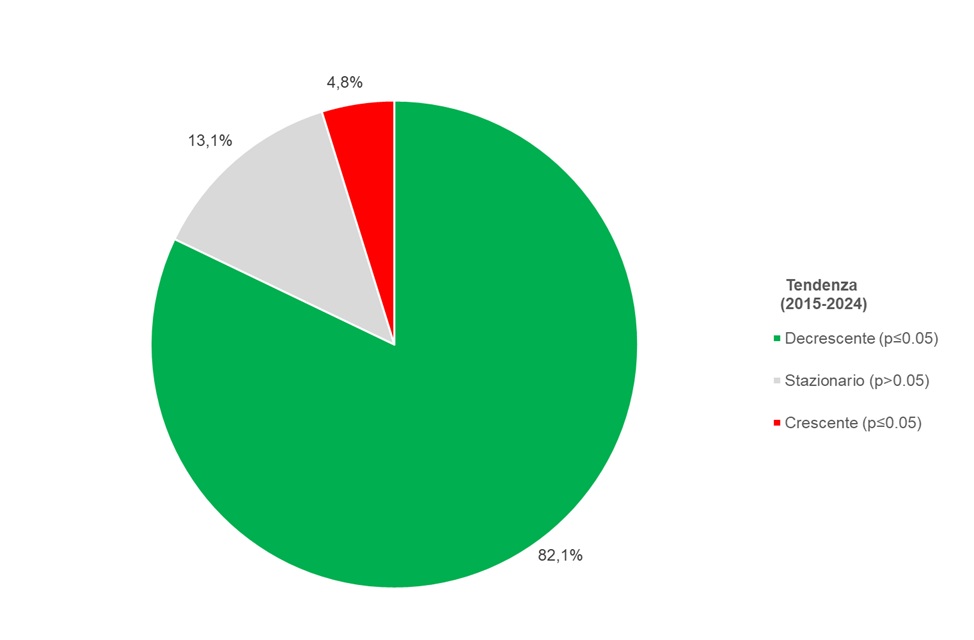
From the statistical analysis conducted with the Mann-Kendall method corrected for seasonality, for NO 2 a is observed trend statistically significant decreasing in 82% of cases (427 monitoring stations out of 520), with estimated average annual variation: -1.1 µg/m³y [-6.2 µg/m³y ÷ 0 µg/m³y]) (Figures 4 and 5). On the portion of the sample considered for which a statistically significant decreasing trend was identified, an average annual reduction of 4.2% (-17.4% ÷ -1.1%) is observed, indicative of the existence of an underlying tendency to reduce NO concentrations 2 in Italy (Table 4).
| Allegati |
|---|
Thumbnail
Titolo
Figure 1: NO₂ – Classification of sampling sites according to the macroscale siting criteria (Annex III, Legislative Decree 155/2010) (2024) Fonte
Processing by ISPRA based on SNPA data |
Thumbnail
Titolo
Figure 2: NO₂ – Monitoring stations and exceedances of the hourly limit value for the protection of human health (2024) Fonte
Processing by ISPRA based on SNPA data |
Thumbnail
Titolo
Figure 3: NO₂ – Monitoring stations and exceedances of the annual limit value for the protection of human health (2024) Fonte
Processing by ISPRA based on SNPA data |
Thumbnail
Titolo
Figure 4: NO₂ – Spatial distribution of the analysed monitoring stations and estimated average annual percentage change in concentration. Fonte
Processing by ISPRA based on SNPA data Legenda
Results of the trend analysis using the seasonality-adjusted Kendall test on a sample of 520 monitoring stations (2015–2024). |
Thumbnail
Titolo
Figure 5: NO₂ – Percentage distribution of monitoring stations according to the observed trend over the period 2015–2024. Fonte
Processing by ISPRA based on SNPA data Legenda
p ≤ 0.05: the observed trend is statistically significant p > 0.05: the null hypothesis (no trend) cannot be rejected Note
Summary of the results of the trend analysis (2015–2024) using the seasonality-adjusted Kendall test on NO₂ concentrations in Italy, based on a selection of 520 monitoring stations distributed across the national territory |
Titolo
Table 1 – NO₂: Monitoring stations – data and statistical parameters for air quality assessment (2024) Fonte
Processing by ISPRA based on SNPA data Legenda
“1” Zone type: U = URBAN; S = SUBURBAN; R = RURAL “2” Station type: T = TRAFFIC; B = BACKGROUND; I = INDUSTRIAL “3” Values shown in bold are reported on the map. Values are highlighted in bold only for data series with at least 90% valid data, net of losses due to periodic calibration or routine maintenance, in accordance with the quality criteria defined by current legislation (Legislative Decree 155/2010). “–” Value not calculated due to lack of data. |
Titolo
Table 2 – NO₂: Classification of zones with respect to assessment thresholds and verification of exceedances of the hourly limit value in accordance with Legislative Decree 155/2010 (2024) Fonte
Processing by ISPRA based on SNPA data Legenda
Zone: a delimited portion of the national territory, as defined by Legislative Decree 155/2010, for the purposes of ambient air quality assessment and management; Agglomeration: a zone consisting of an urban area or a group of urban areas located no more than a few kilometres apart, or of a main urban area together with a set of smaller urban areas that depend on the main one in terms of population, services, and flows of people and goods, having:
Hourly limit value (LV) exceedance: an exceedance is considered to have occurred when it is detected at least at one monitoring station located within the territory of the zone. Classification:
(a) Exceedance assessment obtained through modelling. Note
Exceedance of the upper and lower assessment thresholds shall be determined on the basis of ambient air pollutant concentrations over the five preceding calendar years. An exceedance is considered to occur if the assessment threshold has been exceeded in at least three of the five preceding calendar years. |
Titolo
Table 3 – NO₂: Classification of zones with respect to assessment thresholds and verification of exceedances of the annual limit value in accordance with Legislative Decree 155/2010 (2024) Fonte
Processing by ISPRA based on SNPA data Legenda
Zone: a delimited portion of the national territory, as defined by Legislative Decree 155/2010, for the purposes of ambient air quality assessment and management; Agglomeration: a zone consisting of an urban area or a group of urban areas located no more than a few kilometres apart, or of a main urban area together with a set of smaller urban areas that depend on the main one in terms of population, services, and flows of people and goods, having:
Annual limit value (LV) exceedance: an exceedance is considered to have occurred when it is detected at least at one monitoring station located within the territory of the zone. Classification:
(a) Exceedance assessment obtained through modelling. Note
Exceedance of the upper and lower assessment thresholds shall be determined on the basis of ambient air pollutant concentrations over the five preceding calendar years. An exceedance is deemed to occur if the assessment threshold has been exceeded in at least three of the five preceding calendar years. |
Titolo
Table 4: NO₂ – Trend analysis by monitoring station (2015–2024) Fonte
Processing by ISPRA based on SNPA data Legenda
p ≤ 0.05: the observed trend is statistically significant p > 0.05: the null hypothesis (no trend) cannot be rejected Δy: estimated average annual change based on the results of the seasonality-adjusted Kendall test |
The monitoring stations that measured and reported NO 2 there are 625. Of these, 605 (96.8% of the total) have a minimum time coverage of 90% (net of data losses due to periodic calibration or ordinary maintenance). All regions are represented. The classification of NO monitoring stations 2 according to the macroscale location criteria envisaged by the legislation, it is represented in Figure 1.
The entire national territory is divided into zones and agglomerations for the purposes of assessing the quality of ambient air pursuant to Legislative Decree 155/2010. Each area is classified based on the criteria established by the same decree, with respect to certain thresholds.
The classification is important because the evaluation obligations arise from it and it is normally updated every five years.
If in the year under review a limit value has been exceeded in at least one monitoring station, the entire area is exceeded.
The areas for NO 2 there are 82 in total and are used to assess compliance with both the hourly limit value and the annual limit value (Tables 2 and 3). In 2024, the hourly limit value was not exceeded in any of the 82 zones (Table 2).
The annual limit value was exceeded in 7 areas, all of the agglomeration type, belonging to 6 regions (Table 3).
the statistical analysis of the trends in NO concentrations is also reported 2 determined from 2015 to 2024 in 520 monitoring stations across the country. The sample is homogeneous, i. e. All these stations produced data continuously over the period, with an annual coverage of at least 75% (Table 4).