Valter Bellucci, Sonia Rossi (Istat), Giovanni Seri (Istat)
The indicator provides information on the use of pesticides in individual crops. The data is collected through sample surveys on the quantities of pesticides used on specific crops and provides a significant representation of the intensity of use in terms of quantity/hectare and the potential environmental impact. In the 2014-2024 period, in relation to the objectives set out in the National Action Plan on the sustainable use of pesticides, the survey requires that two crops be surveyed each year, selected in rotation between grapevines, durum wheat, corn, tomatoes, and potatoes. Rotation allows for the survey of the different crops to be distributed over time, including, where possible, the repetition of at least one of the crops already surveyed the previous year, thus ensuring greater continuity in data availability and enabling comparisons over time.
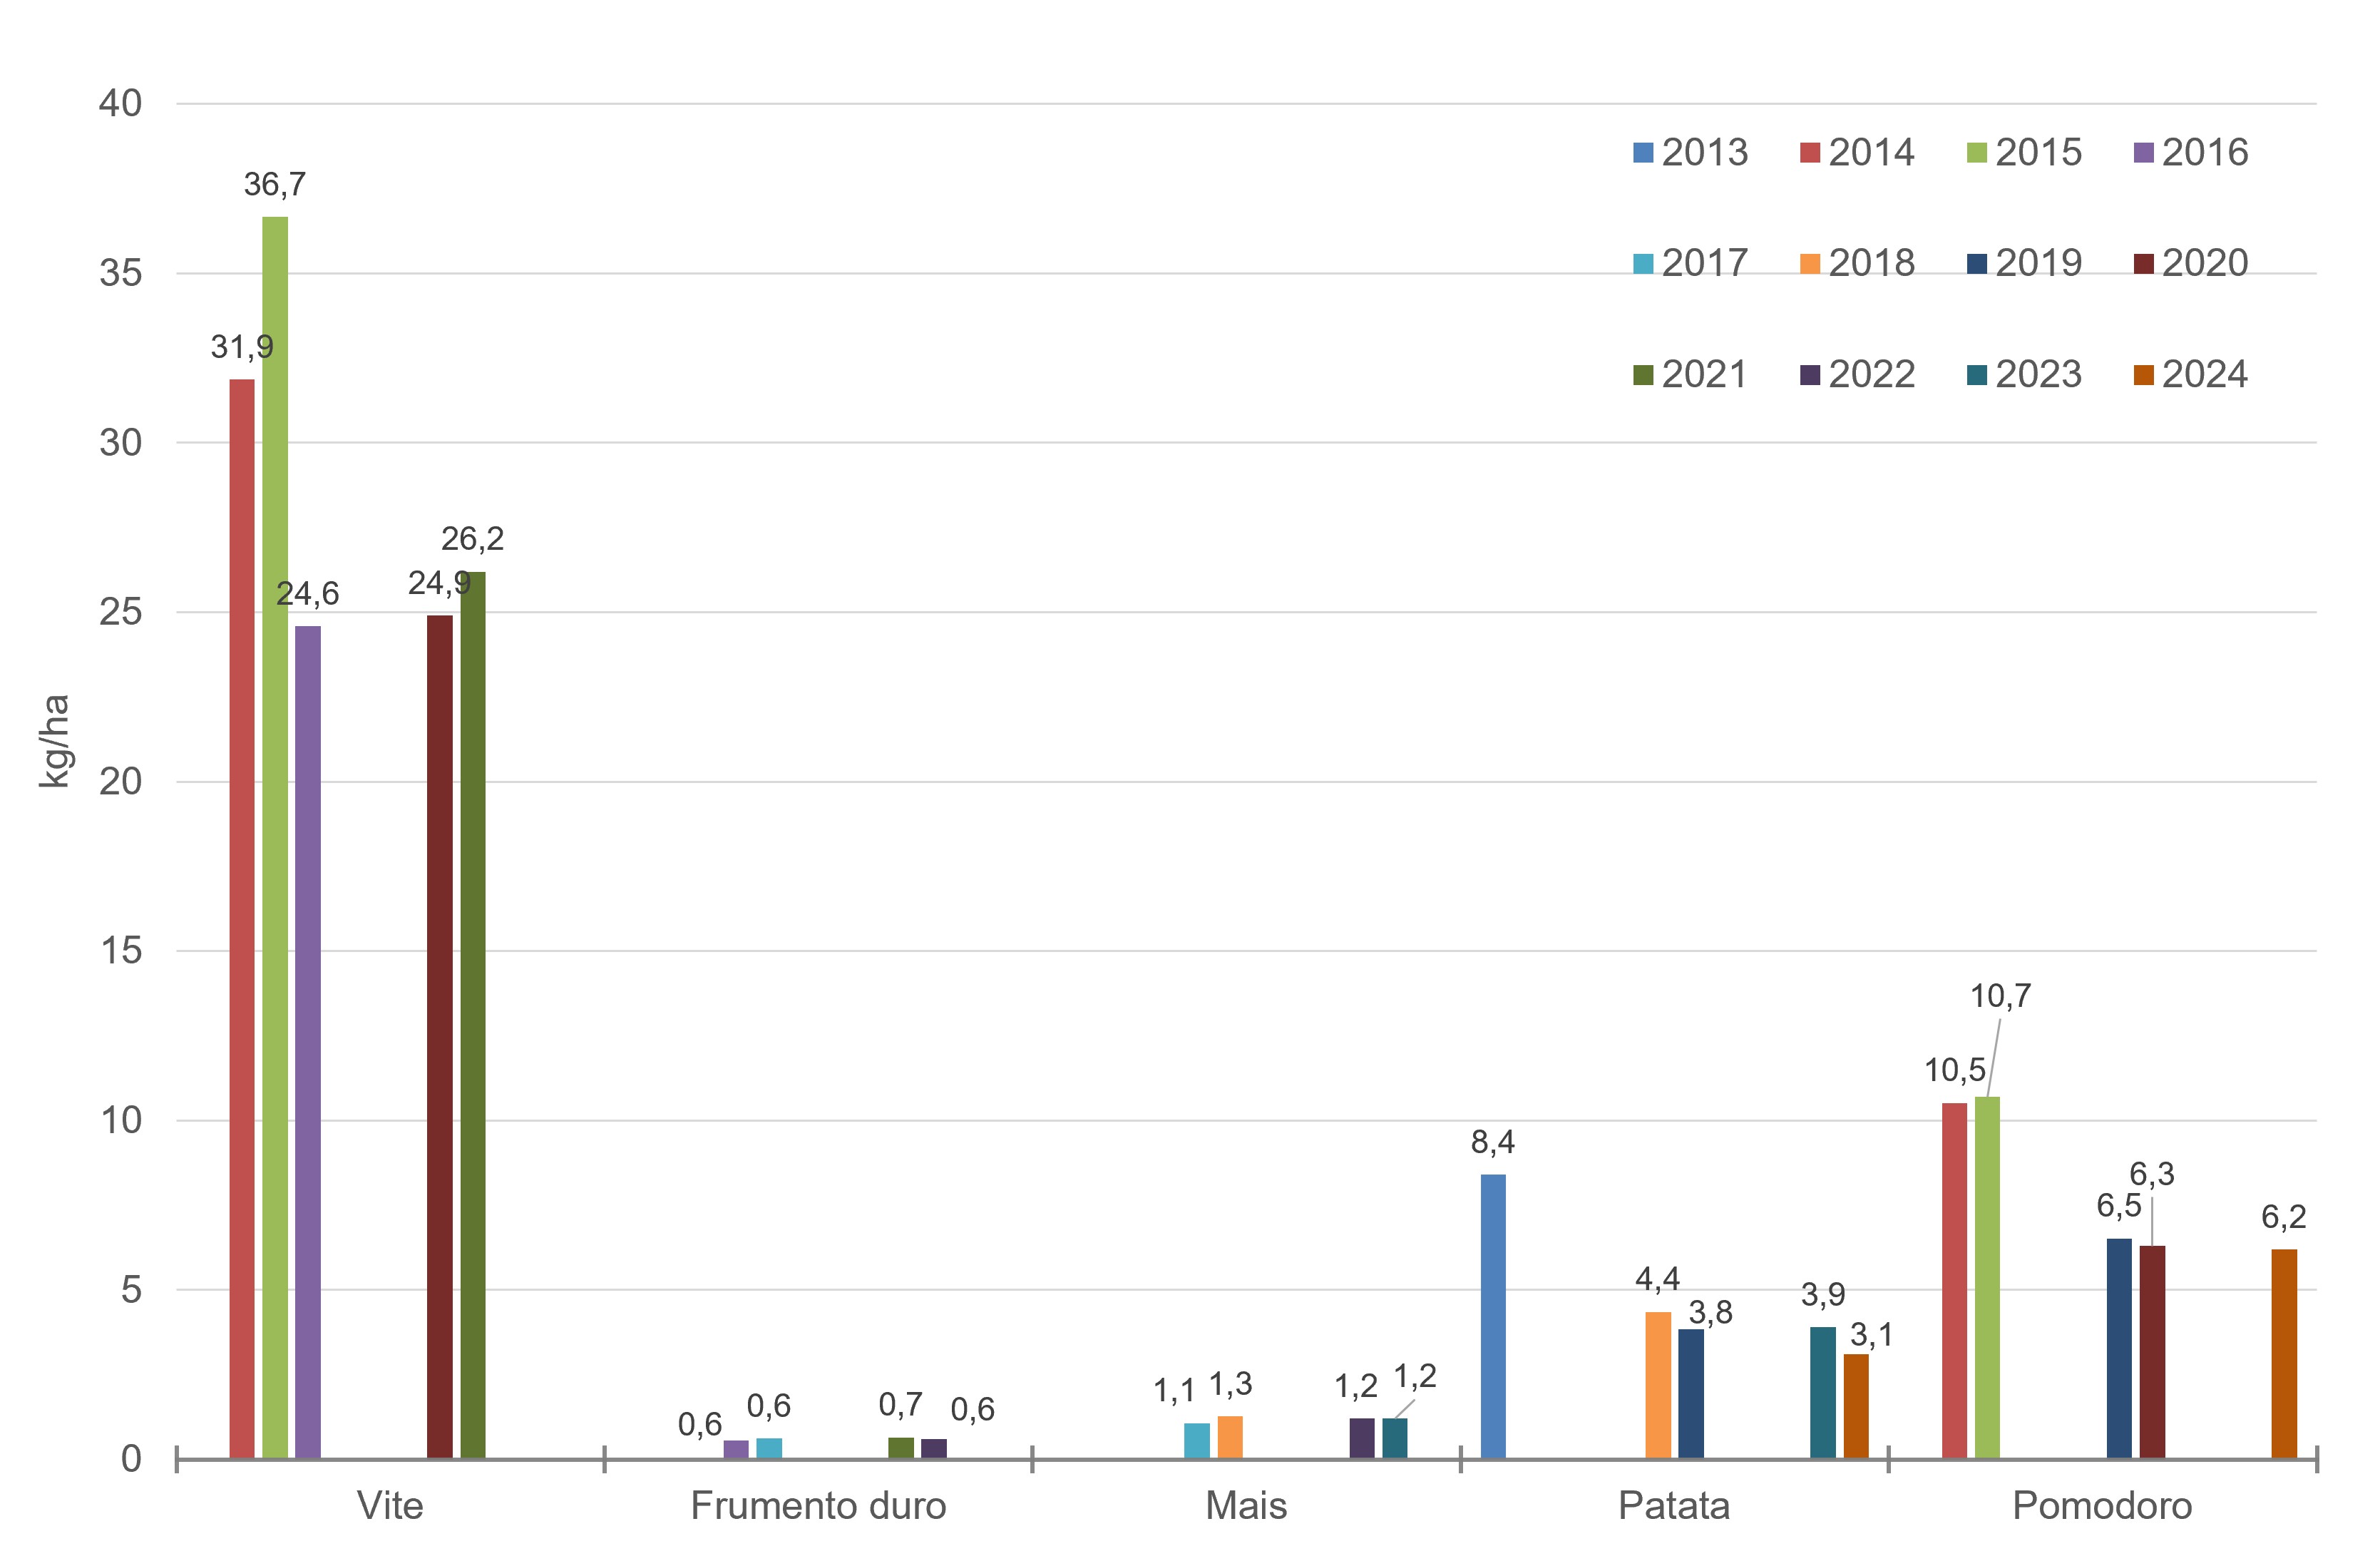
Among those observed, grapevines are confirmed as the crop with the significantly highest distribution of active substances and average quantity per hectare, especially of fungicides.
The indicator provides information on the use of pesticides in individual crops as defined by the PAN (National Action Plan on the Sustainable Use of Plant Protection Products). The crops surveyed are selected based on their agricultural importance and the information needs associated with monitoring the use of pesticides.
Originally, the survey covered only one crop per year, with each crop being re-surveyed after an interval of approximately five years. In the 2014-2024 period, in accordance with the objectives set out in the National Action Plan on the Sustainable Use of Plant Protection Products, the survey was expanded in both the number of crops and its frequency. Each year, two crops are surveyed, selected in rotation from grapevines, durum wheat, corn, tomatoes, and potatoes. Crop rotation allows for the distribution of crop surveys over time, including, where possible, repeating at least one crop surveyed the previous year. This ensures greater continuity in data availability and allows for comparison over time. Data are collected through sample surveys on the quantities of plant protection products used on specific crops and provide a significant representation of their intensity in terms of quantity/ha and potential environmental impact. The data are collected directly by ISTAT, the competent national authority mandated under national and EU legislation.
Provide information on the intensity of product use in order to evaluate progress in the use of plant protection products in relation to both national guidelines and European Union strategies for environmental protection and the development of sustainable agriculture.
The “Farm to Fork strategy, within the framework of the European Green Deal, and the EU Biodiversity Strategy for 2030.
Regulation (EC) No. 1107/2009 of the European Parliament and of the Council of 21 October 2009 concerning the placing of plant protection products on the market.
Directive 2009/128/EC of the European Parliament and of the Council of 21 October 2009 establishing a framework for Community action to achieve the sustainable use of pesticides.
Regulation (EC) No. 1185/2009 of the European Parliament and of the Council of 25 November 2009 on statistics on pesticides, repealed by Regulation (EU) 2022/2379 (SAIO) with effect from 1 January 2025.
Legislative Decree 14 August 2012, n. 150 implementing Directive 2009/128/EC establishing a framework for Community action for the sustainable use of pesticides.
Inter-ministerial Decree 22 January 2014. Adoption of the National Action Plan for the sustainable use of plant protection products, pursuant to Article 6 of Legislative Decree 14 August 2012, n. 150.
Interministerial Decree of 10 March 2015. Guidelines for the protection of the aquatic environment and drinking water and for the reduction of the use of plant protection products and related risks in Natura 2000 sites and protected natural areas.
Interministerial Decree of 15 July 2015. Methods of data collection and processing for the application of the indicators provided for by the National Action Plan for the sustainable use of plant protection products.
Legislative Decree of 9 February 2012, no. 5, coordinated with the conversion law of 4 April 2012, no. 35, containing: «Urgent provisions on simplification and development.» [Art. 28 - Amendments relating to the corporate handling of waste and temporary storage].
Ministerial Decree of the Ministry of Agricultural and Forestry Policies of 10 December 2013, no. 15414.
Amendment to Ministerial Decree of 22 December 2009, no. 30125, and subsequent amendments, containing "Rules for the cross-compliance regime pursuant to Regulation (EC) no. 73/2009 and reductions and exclusions for non-compliance by beneficiaries of direct payments and rural development programmes".
Eurostat, 2019, Research paper Statistics on agricultural use of pesticides in the European Union (https://ec.europa.eu/
Eurostat, Pesticide use in agriculture, Eurostat metadata, aei_pestuse dataset.
Istat, Use of plant protection products in agricultural crops, agricultural year 2023-2024.
Limited frequency of surveys within the same crop.
Increase the number of crops surveyed each year and the frequency of surveys for specific representative crops, also in accordance with the objectives set by the National Action Plan on the sustainable use of plant protection products.
Istat (National Institute of Statistics)
Istat, Survey on the Use of Plant Protection Products in Agricultural Crops (https://esploradati.istat.it/databrowser/#/it/dw/categories/IT1,Z1000AG…)
National
2013-2024
Kilograms (kg), Kilogram per hectare (kg/ha), Number (n.), Number per hectare (n./ha)
PAN Indicator (National Action Plan for the Sustainable Use of Plant Protection Products) – Interministerial Decree of 15 July 2015
Data is collected from farms using a combined CAWI-CATI technique (CAWI only from 2022), which allows farms to self-complete the online questionnaire or respond to a telephone interview. For the reference crop, data is collected on: cultivated area, total area treated, area treated with a single pesticide, quantity of pesticide used, and pesticide treatments performed by type (fungicides, insecticides and acaricides, miscellaneous and herbicides). The quantity of product being processed is converted into the quantity of the corresponding active ingredient. With this data, it is possible to calculate various parameters, including: the average number of treatments carried out per active substance per treated base area (ratio between the area treated with each active substance and the base area treated with the corresponding active substance), the average quantity of active substances applied per treated base area (ratio between the quantity used and the treated base area), and the average quantity of active substances per cultivated area (ratio between the quantity used and the total cultivated area).
The survey is conducted by ISTAT as part of statistics on the use of plant protection products in agricultural crops, in implementation of Regulation (EC) No. 1185/2009.
In the 2023-2024 crop year, the survey covered potato and tomato crops. The data highlight differences in the intensity of pesticide use between the two crops (Tables 1 and 2).
In 2024, for potatoes, the overall average number of treatments was 11.3 per hectare, unchanged from 2023. The total quantity of active ingredients used was approximately 132.4 tonnes, corresponding to 3.1 kg/ha of treated area. Fungicides represent the most significant component in terms of quantity, with approximately 81.3 tons of active ingredients and 2.0 kg/ha.
For tomatoes, approximately 569.0 tons of active ingredients were detected in 2024, equal to 6.2 kg/ha of treated area, while the overall average number of treatments was 15.3 per hectare. In this case too, fungicides constitute the predominant component in terms of quantity, with approximately 492.3 tons of active ingredients and 5.4 kg/ha.
Overall, in 2024, tomatoes showed higher values than potatoes both for the average number of treatments per hectare and for the average quantity of active ingredients used per hectare of treated area. The comparison between the two crops must be considered in light of the different agronomic characteristics and specific phytosanitary defense needs.
In particular, it emerges that in the crops examined, the quantities of pesticides distributed do not show significant variations compared to the previous survey, despite the fact that potatoes and tomatoes, both solanaceous plants, have suffered significant fungal adversities such as downy mildew (Phytophthora infestans) and Alternaria favored by the weather trend and the conditions of humidity and rainfall in spring and summer.
The values reported in Tables 1 and 2 confirm, in their variability, the difficulties in interpreting this type of data. A rather long period of time is required to have a sufficient number of reference years. Furthermore, the results are by their nature dependent on factors that are difficult to control, such as weather patterns or the occurrence of pest emergencies. These factors, combined with the varying incidence of various crops, make international comparisons particularly complicated.
| Data |
|---|
Titolo
Tabella 1: Trattamenti fitosanitari per ettaro effettuati sulle singole coltivazioni in diverse annate agrarie Fonte
Istat Legenda
* Il numero medio di trattamenti è riferito alla "superficie complessivamente trattata" ed è ottenuto dal rapporto tra Superficie Trattata con Sostanze Attive (ASAT) e Superficie di Base Trattata (BAT). **La BAT rimane costante per tutte le categorie incluso il totale. Le ASAT, invece, cambiano per tutte le categorie di Sostanze attive. In alcuni casi un prodotto può contenere più Sostanze attive e quindi la somma delle singole ASAT non coincide con le ASAT per singola tipologia di Sostanza attiva.
|
Titolo
Tabella 2: Quantità di principi attivi utilizzati nelle singole coltivazioni in diverse annate agrarie Fonte
Istat Legenda
* Includono Fitoregolatori e Molluschicidi, fumiganti e non, e altri prodotti fitosanitari e principi attivi vari |
Thumbnail
Titolo
Figura 1: Chilogrammi di principi attivi utilizzati per ettaro di superficie trattata Fonte
Elaborazione ISPRA su dati Istat |
Making an overall comparison with previous surveys, grapevines (2021 data) confirm their position as the crop with the highest distribution of active substances and the highest average quantity per hectare, with over 17.5 million kg of total plant protection products and 26.2 kg/ha, mostly fungicides. The other crop with the highest amount of plant protection products used is tomatoes, for which—similarly to grapevines—fungicides constitute over 80% of the total active ingredients used (Figure 1).
Techniques to reduce or eliminate the numerous treatments with chemical fungicides should integrate: preventive agronomic practices, forecasting models, and natural or microbiological solutions.