Gabriele Bellabarba, Maria Logorelli
The indicator describes the activity carried out by ARPA/APPA in terms of preventive opinions and checks carried out with measuring instruments on high frequency (RF) sources, distinguished between radio and television systems (RTV) and base transceiver stations for communication (BTS). For RTV systems yes records in 2024 a number of preventive opinions issued by the ARPA/APPA equal to 494, showing a significant decrease (-22%) compared to 2023. In 2024, for the number of controls for the BTSs, compared to the previous year, there was a decrease of 20.6%, going from 2,139 to 1,699. The requests for control by citizens through complaints tend to decrease and this gives the perception of a social pressure that tends to fade even for a type of electromagnetic source, such as the Base Radio Station, which in the past has caused many concerns.
The indicator describes the activity carried out by ARPA/APPA in terms of preventive opinions and checks carried out with measuring instruments on high frequency (RF) sources, distinguished between radio and television systems (RTV) and base transceiver stations for communication (BTS). Information relating to the number of manual broadband measurements and monitoring campaigns conducted by ARPA/APPA in the vicinity of RTV and SRB systems and the electric field values present in the environment in the presence of this type of electromagnetic sources is also covered.
Quantify the response to the regulatory question regarding the control and supervision activity on RF radio frequency systems (RTV and BTS).
Framework law n. 36/2001
The control activity, during the authorization and operation phase of the plant, is aimed at compliance with the exposure limits, the attention values and the quality objectives for the protection of the population defined by the Prime Ministerial Decree 08/07/03 and subsequent amendments.
Legislative Decree 259/2003 and subsequent amendments is the current regulatory reference that regulates the authorization processes relating to telecommunications systems.
ISPRA, various years, Environmental data yearbook
ISPRA/MASE/SNPA Thematic reports
The information relating to the control activity carried out by the ARPA/APPA obviously has greater spatial and temporal coverage than that relating to the number of plants/services and RTV/RBS sites which are not directly managed by the aforementioned Agencies and which are provided by the managers of the plants in question. However, critical issues remain in this case essentially linked to the availability of data collection tools at a local level (databases, land registers) and the scarcity of human resources within the ARPA/APPA dedicated to this metadata collection activity.
Synergistic actions by the subjects involved in trying to support the flow of information with suitable regulatory tools and with activities aimed at analyzing the critical issues mentioned above in order to shed light on the problems and propose solutions to give greater uniformity and completeness to the data at a national level.
Electromagnetic Fields Observatory
14/20
2008-2024
Calculation of the total number of checks for RTV systems and BTSs on the national territory. Calculation of the total number of preventive opinions for RTV systems, for RBSs on the national territory. The calculation is carried out considering the regions that have provided complete and updated data for both types of electromagnetic source (RTV and BTS).
Considering the data provided by the ARPA/APPA representatives for 2024 (Table 1 and 4), it is highlighted that for BTS systems there are a number of preventive opinions issued and experimental checks carried out (equal to 19,682 and 2,456 respectively, significantly higher than those relating to RTV systems (equal to 474 and 243 respectively). Of the experimental checks carried out on RBS systems, approximately 22.9% were carried out at the request of citizens, while for RTV systems it is equal to 19.3% of the total experimental controls. In the aforementioned calculations, the autonomous regions/provinces that provided the updated and complete data for 2024 for both types of source (RTV and RBS) were considered (Piedmont, Valle d'Aosta, Lombardy, Trentino-Alto Adige, Friuli-Venezia Giulia, Liguria, Emilia-Romagna, Tuscany, Umbria, Lazio, Abruzzo, Molise, Campania, Puglia, Basilicata and Calabria).
For the trend, the autonomous regions/provinces that provided complete data for the time span 2008-2024 for both types of RTV and RBS sources were considered, as well as those for which it was possible to integrate the missing information by reporting the useful information from the previous year or, in the absence of this, that of the first available subsequent year (Piedmont, Valle d'Aosta, Lombardy, Trentino-Alto Adige, Veneto, Friuli-Venezia Giulia, Liguria, Emilia-Romagna, Tuscany, Umbria, Marche, Abruzzo, Puglia and Basilicata).
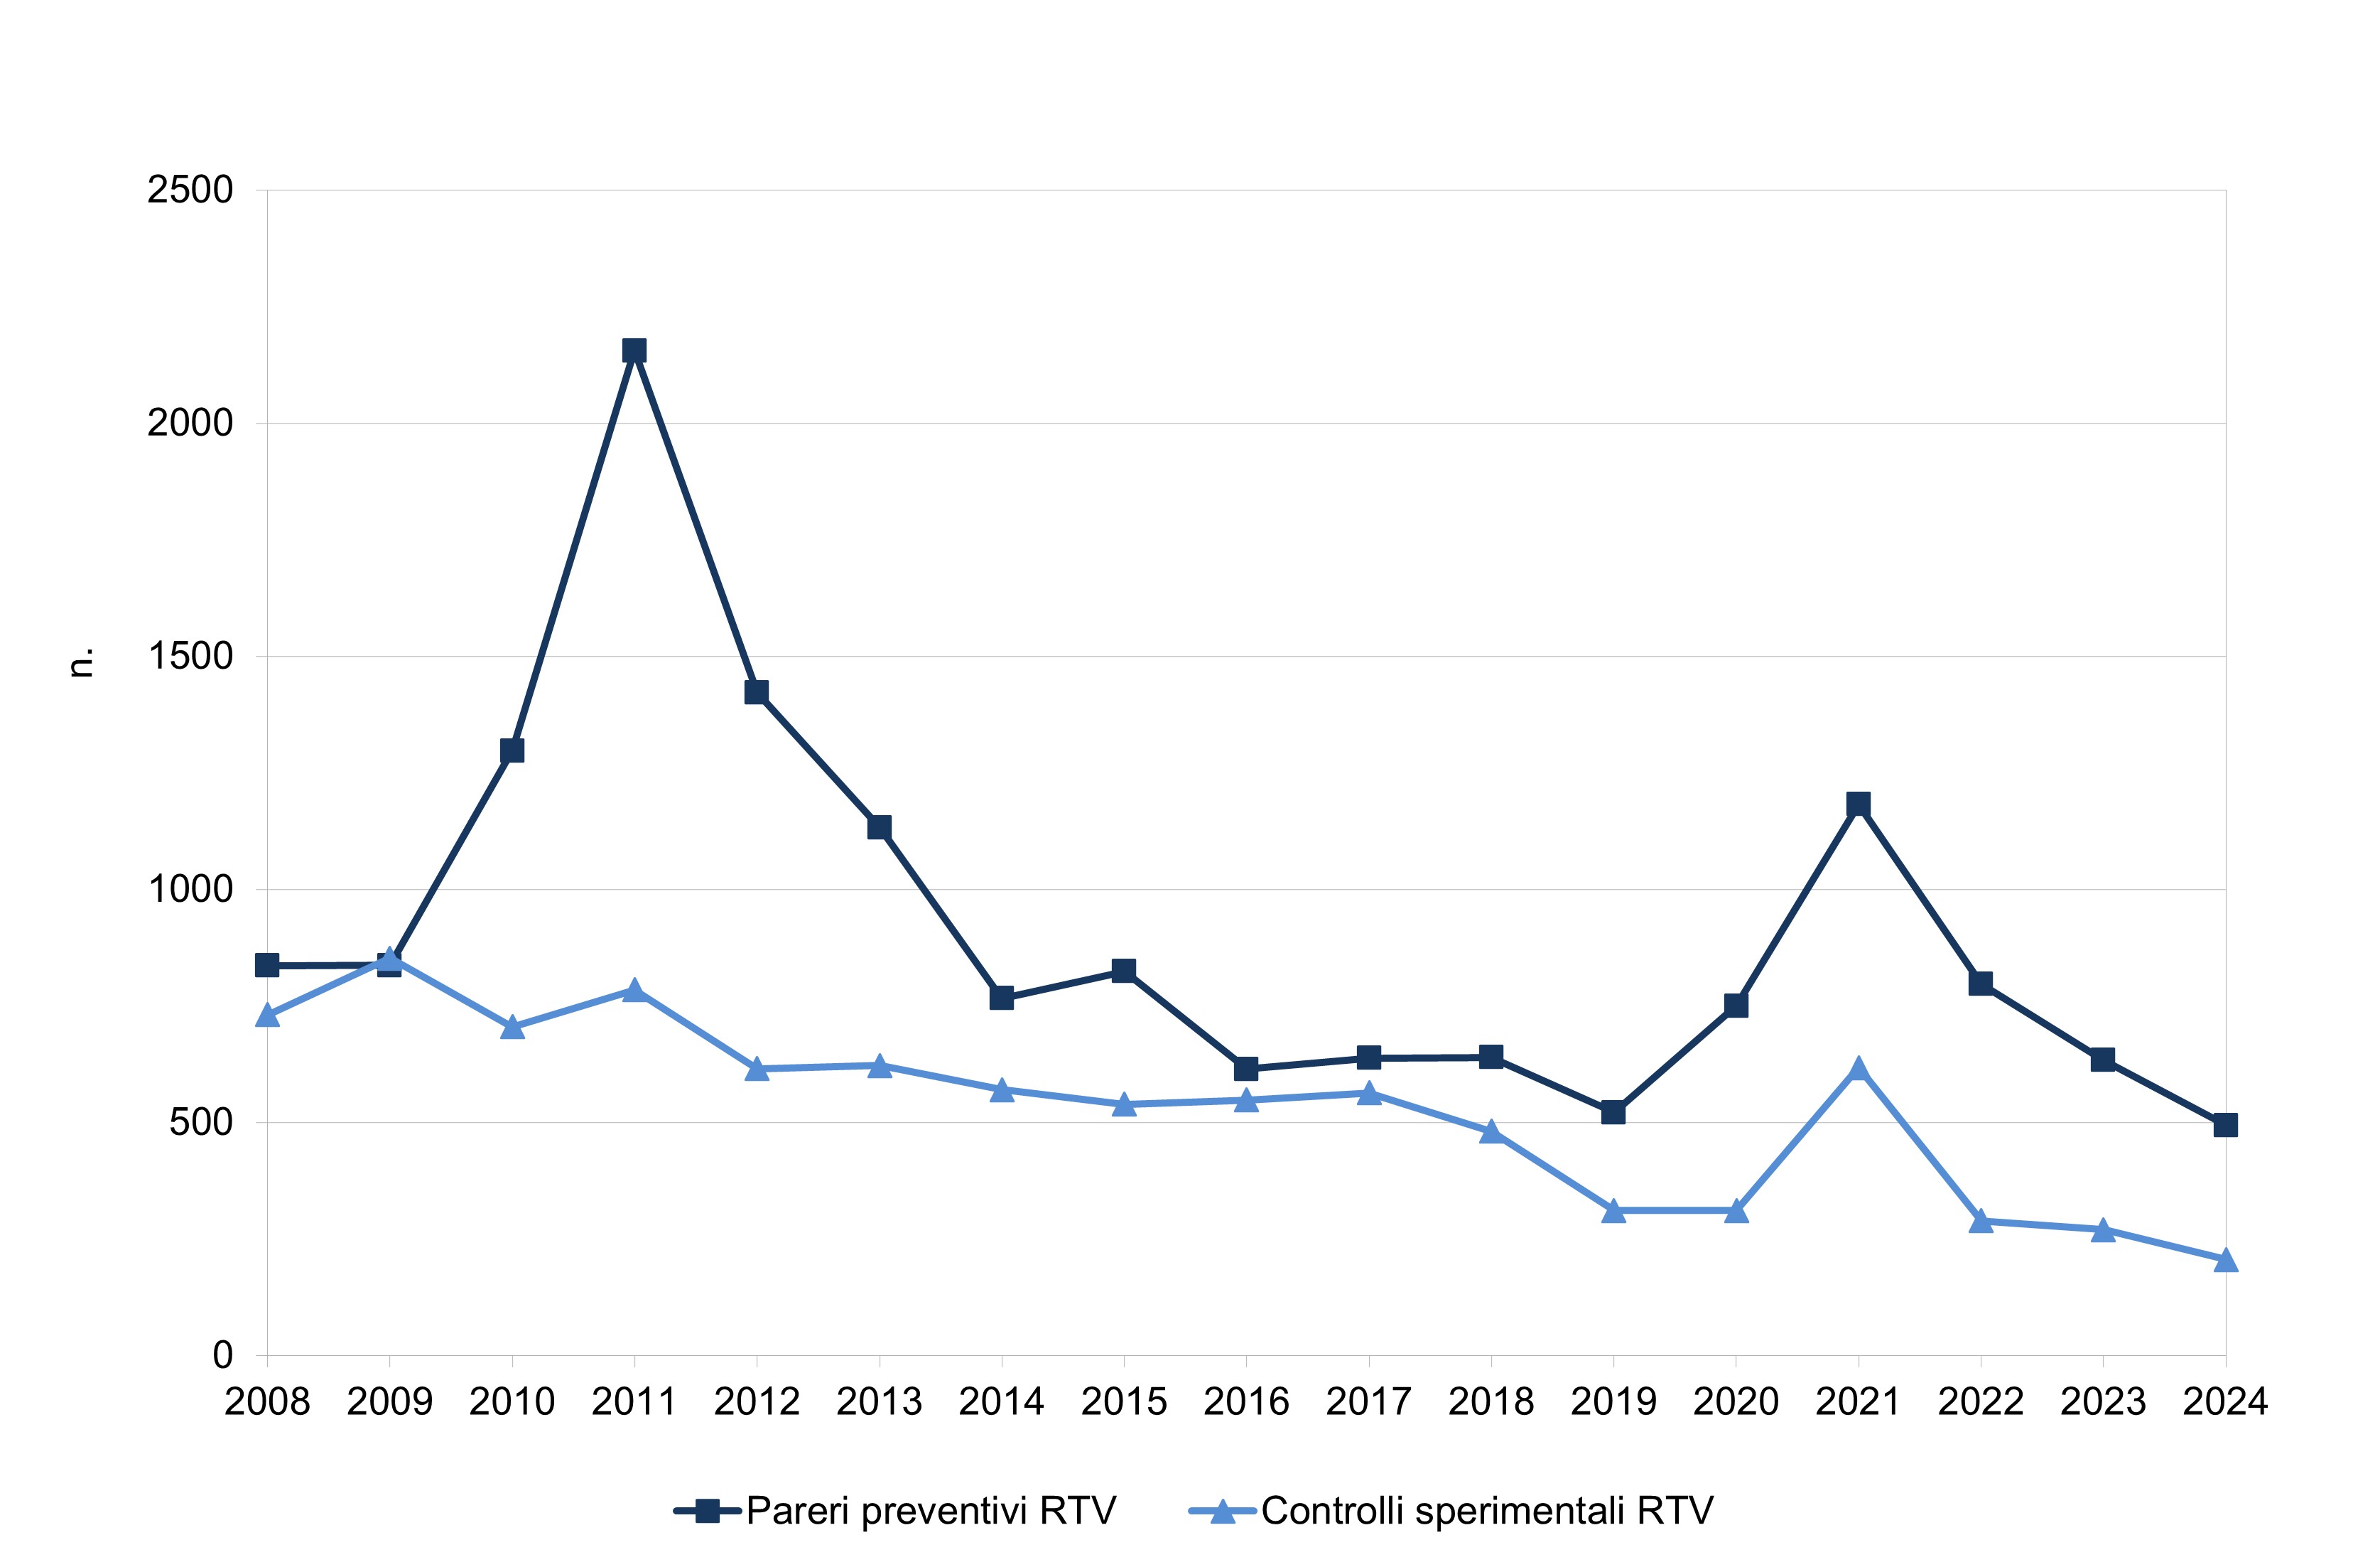
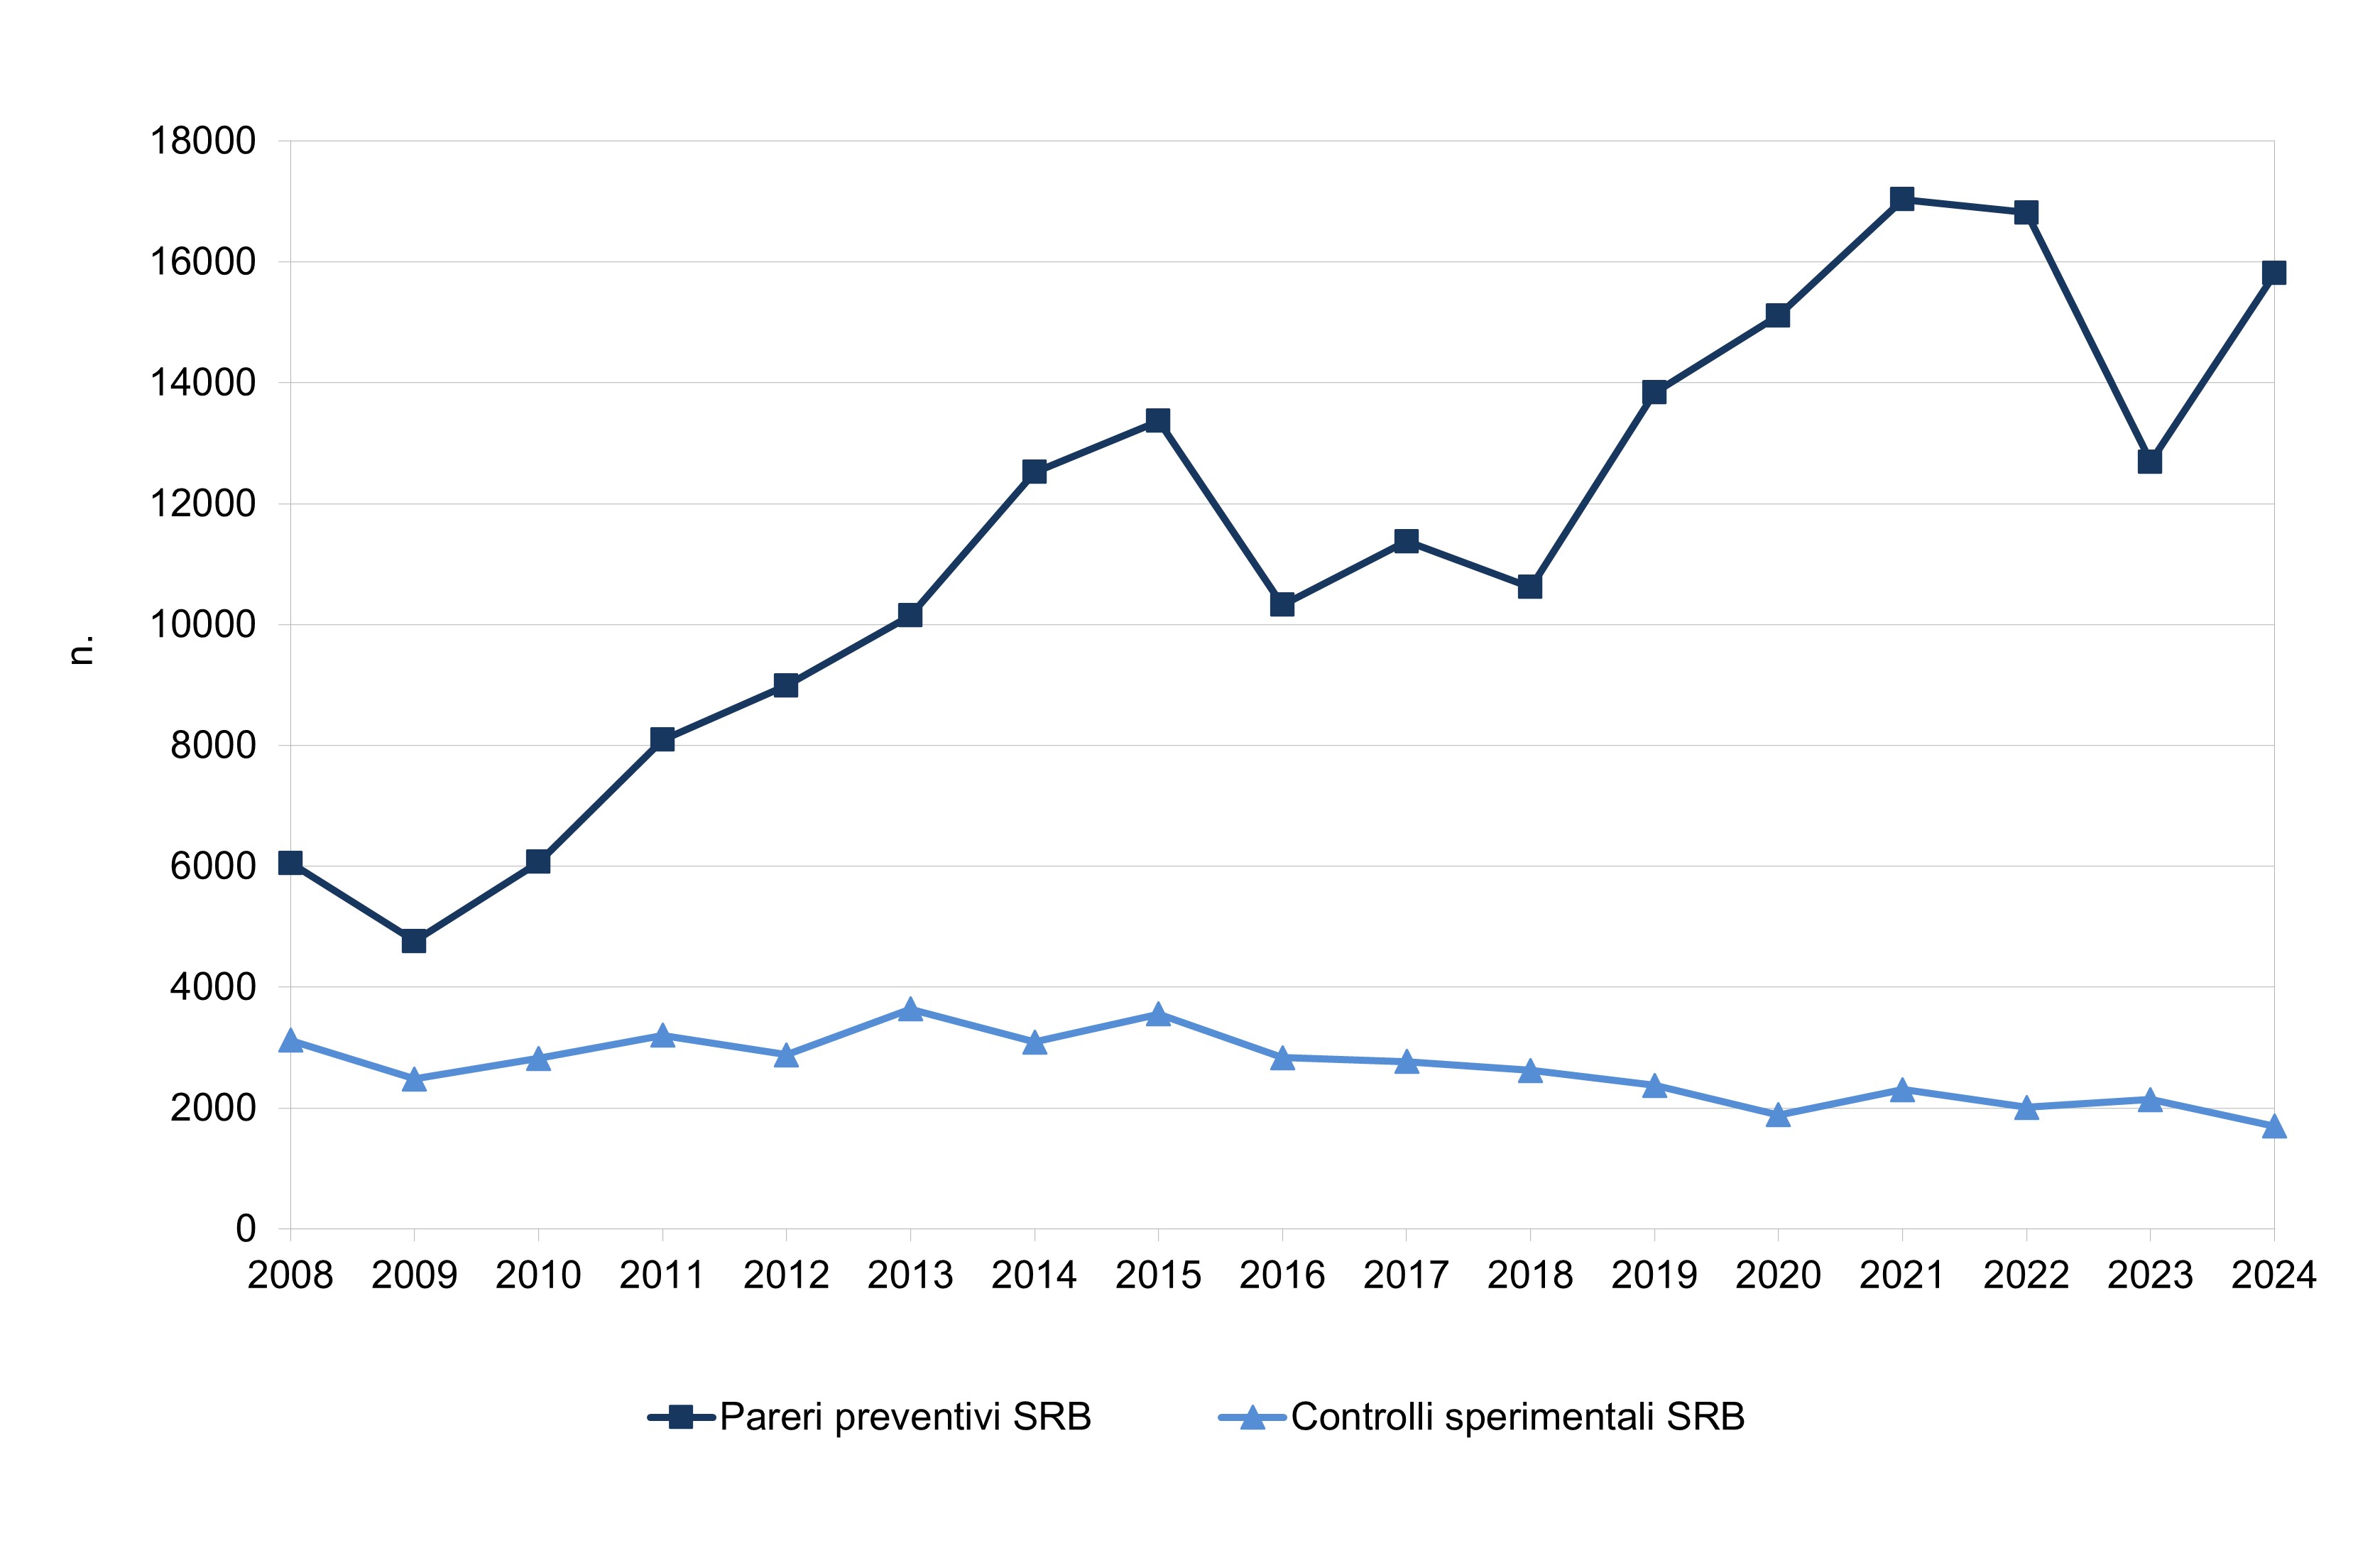
For RTVs, there was a significant growth in preventive opinions from 2008 to 2011, going from 836 to 2,155 (around +158%) probably in relation to the transition from analogue to digital technology and then decreasing significantly until 2019 (-75.8% compared to 2011); in 2020 there was a significant increase (+44%) which continues in 2021 (+57.6%). Subsequently, a constant decrease appears until reaching a value of 494 in 2024 (-22% compared to 2023). In 2024 there is a significant decrease of 58.2% compared to 2021 (Figure 1). For the RBSs, however, with the exception of 2009, there is a constant growth in the preventive opinions issued by the ARPA/APPA from 2008 to 2015, going from 6,050 to 13,367 (approximately +121%). In 2016, compared to the previous year, there was a decrease in the same (-22.8%) presumably also as a consequence of the authorization simplifications introduced by the current legislation. From 2016 to 2018, the trend is rather stable; since 2018 there has been constant growth which, in 2021, reaches +60.4%, going from 10,620 to 17,031. From 2021 to 2023, however, a significant reduction of 25.5% was recorded, before returning to growth (+24.6%) in 2024 (Figure 2).
Regarding the experimental controls, a rather variable trend was highlighted for the RTVs from 2008 to 2011, and then decreased overall by 60.3% until 2019, going from 784 to 311; from 2019 to 2020 the number of experimental checks remained constant and in 2021 there was a notable increase (98.4%) compared to 2020 (going from 311 to 617), also given the significant increase in the number of opinions issued for the plants in question. From 2021 to 2024, in line with the trend of preventive opinions issued, there was a significant decrease in the number of experimental controls equal to 66.6%, going from 617 to 206 (Figure 1). For the RBSs, the number of checks presents a variable trend, oscillating between a maximum of 3,638 in 2013 and a minimum of 1,699 in 2024. In 2024 there was a decrease of 20.6% compared to 2023, going from 2,139 to 1,699 (Figure 2). The decrease in the number of experimental controls is not always associated with a decrease in preventive opinions given that often in the authorization process of RBS services modeling evaluations that do not provide for control interventions in the field may be sufficient.
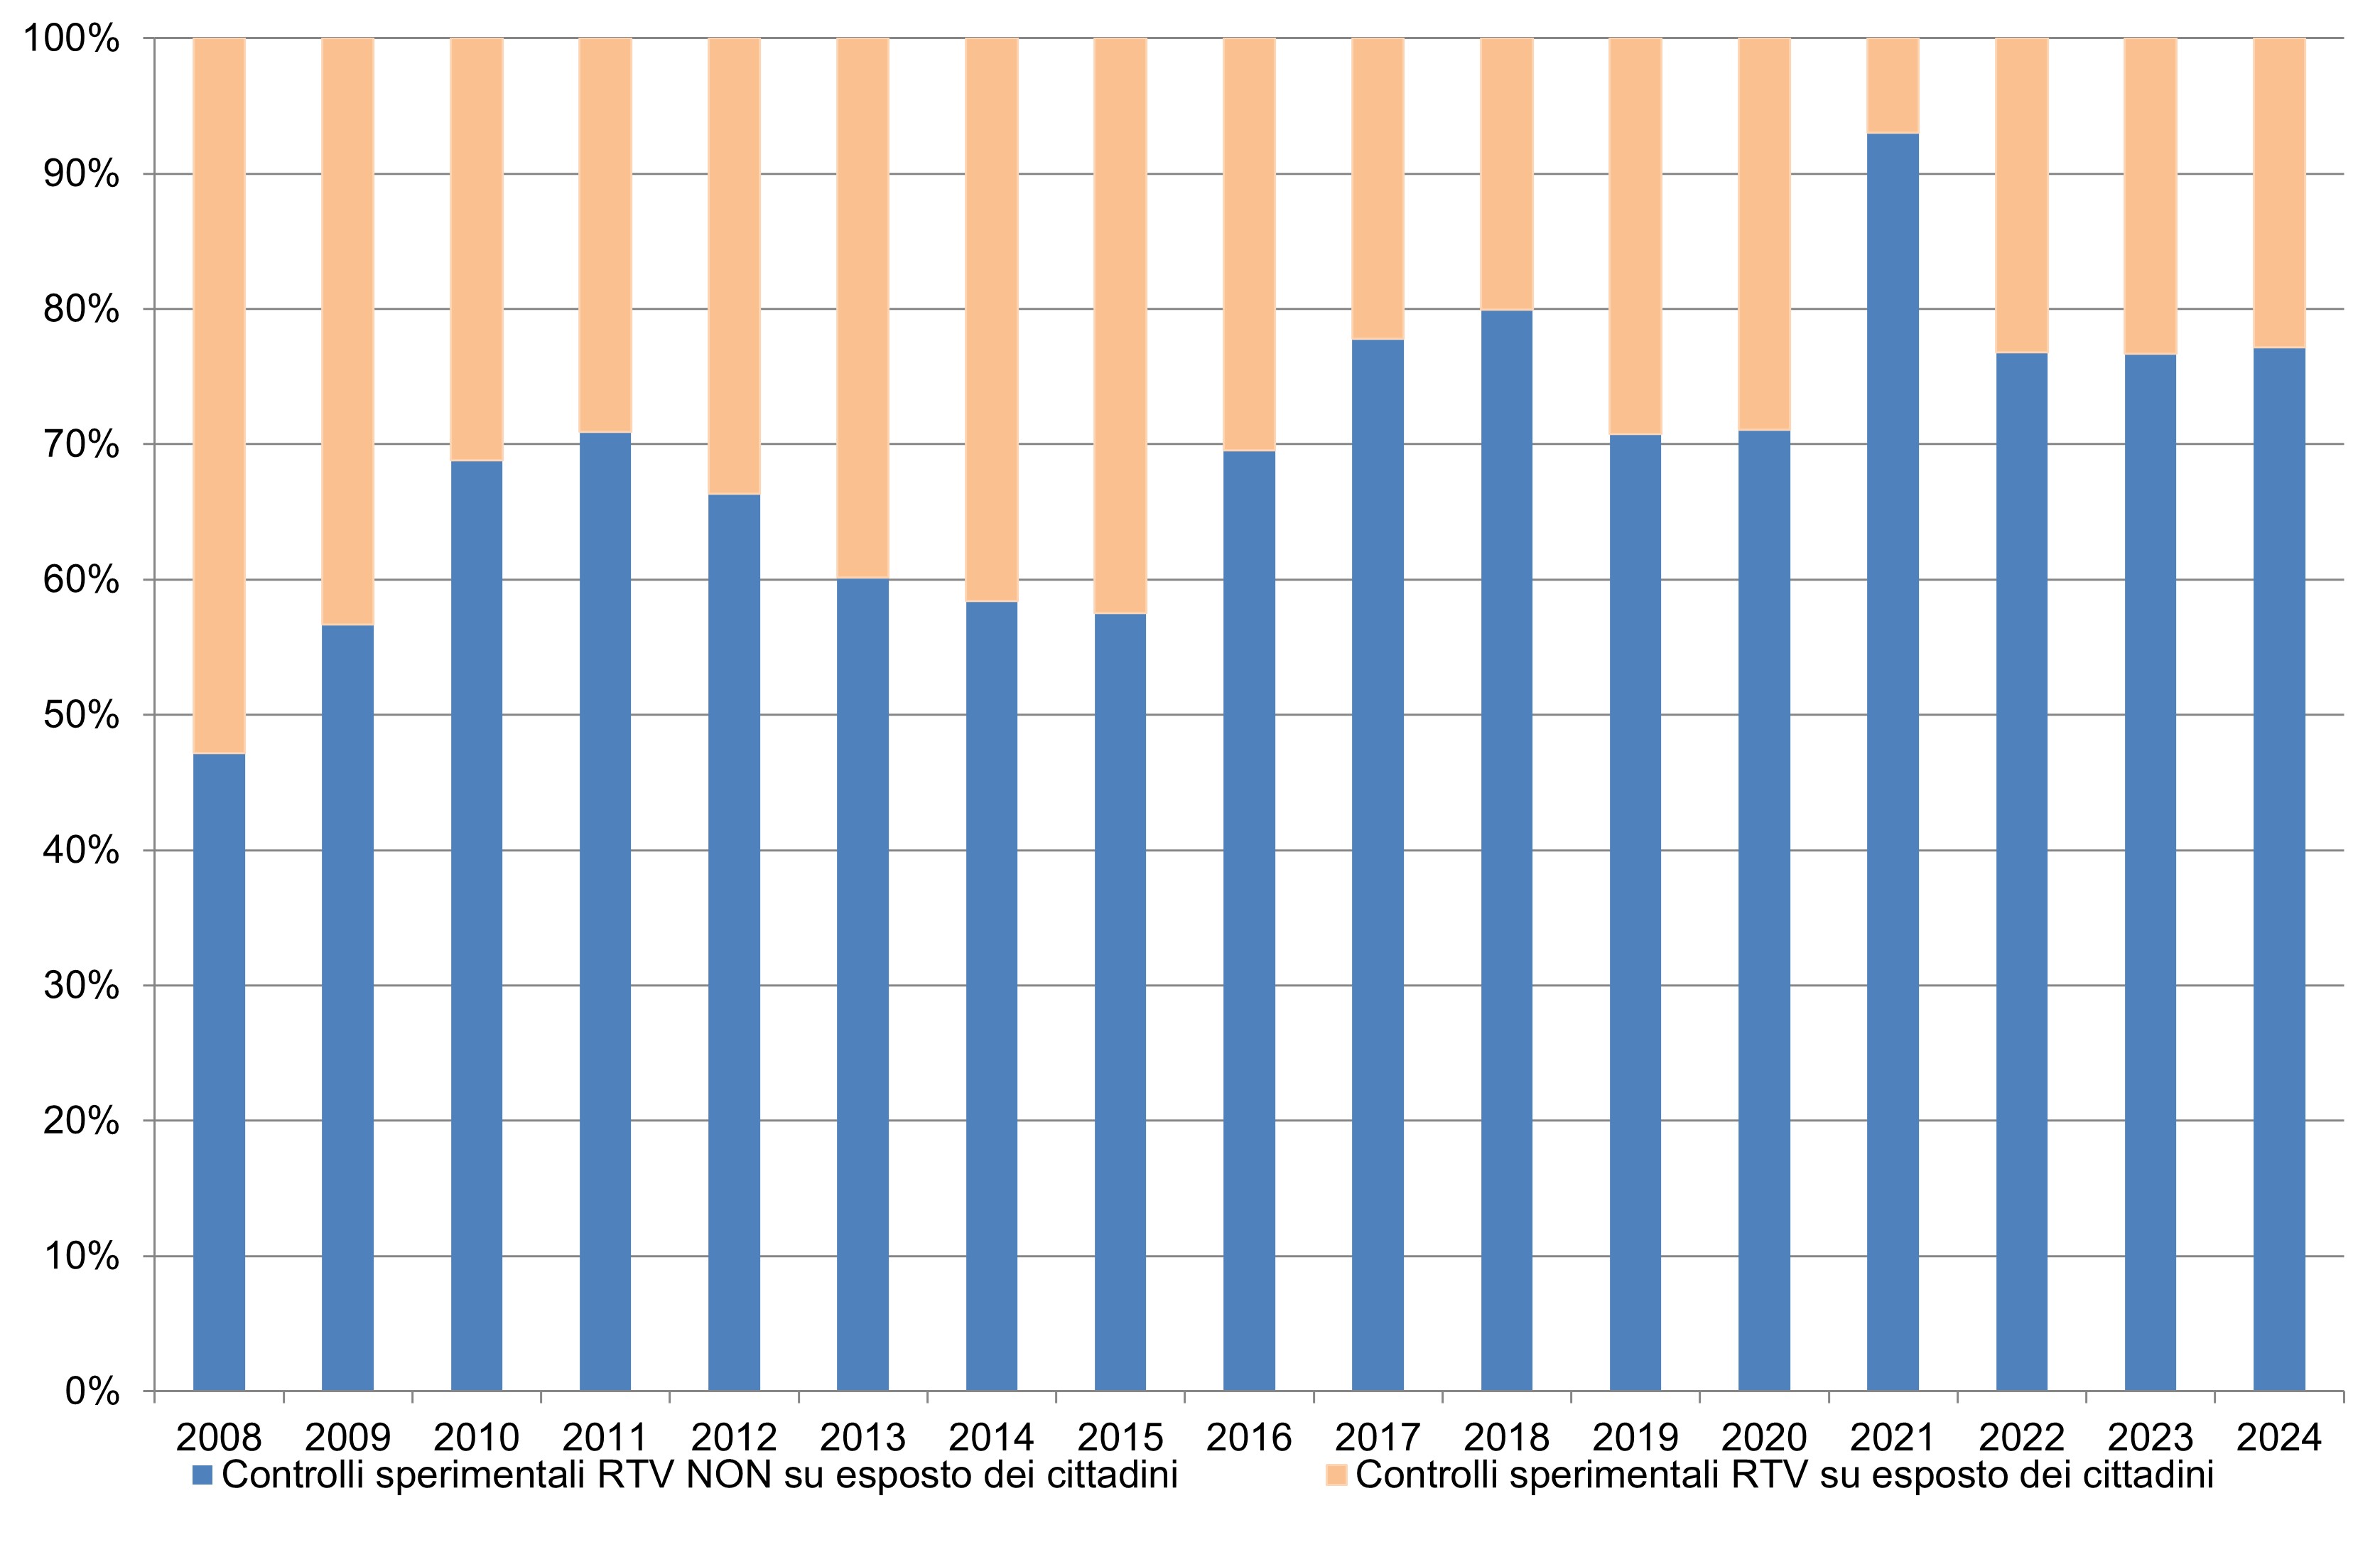
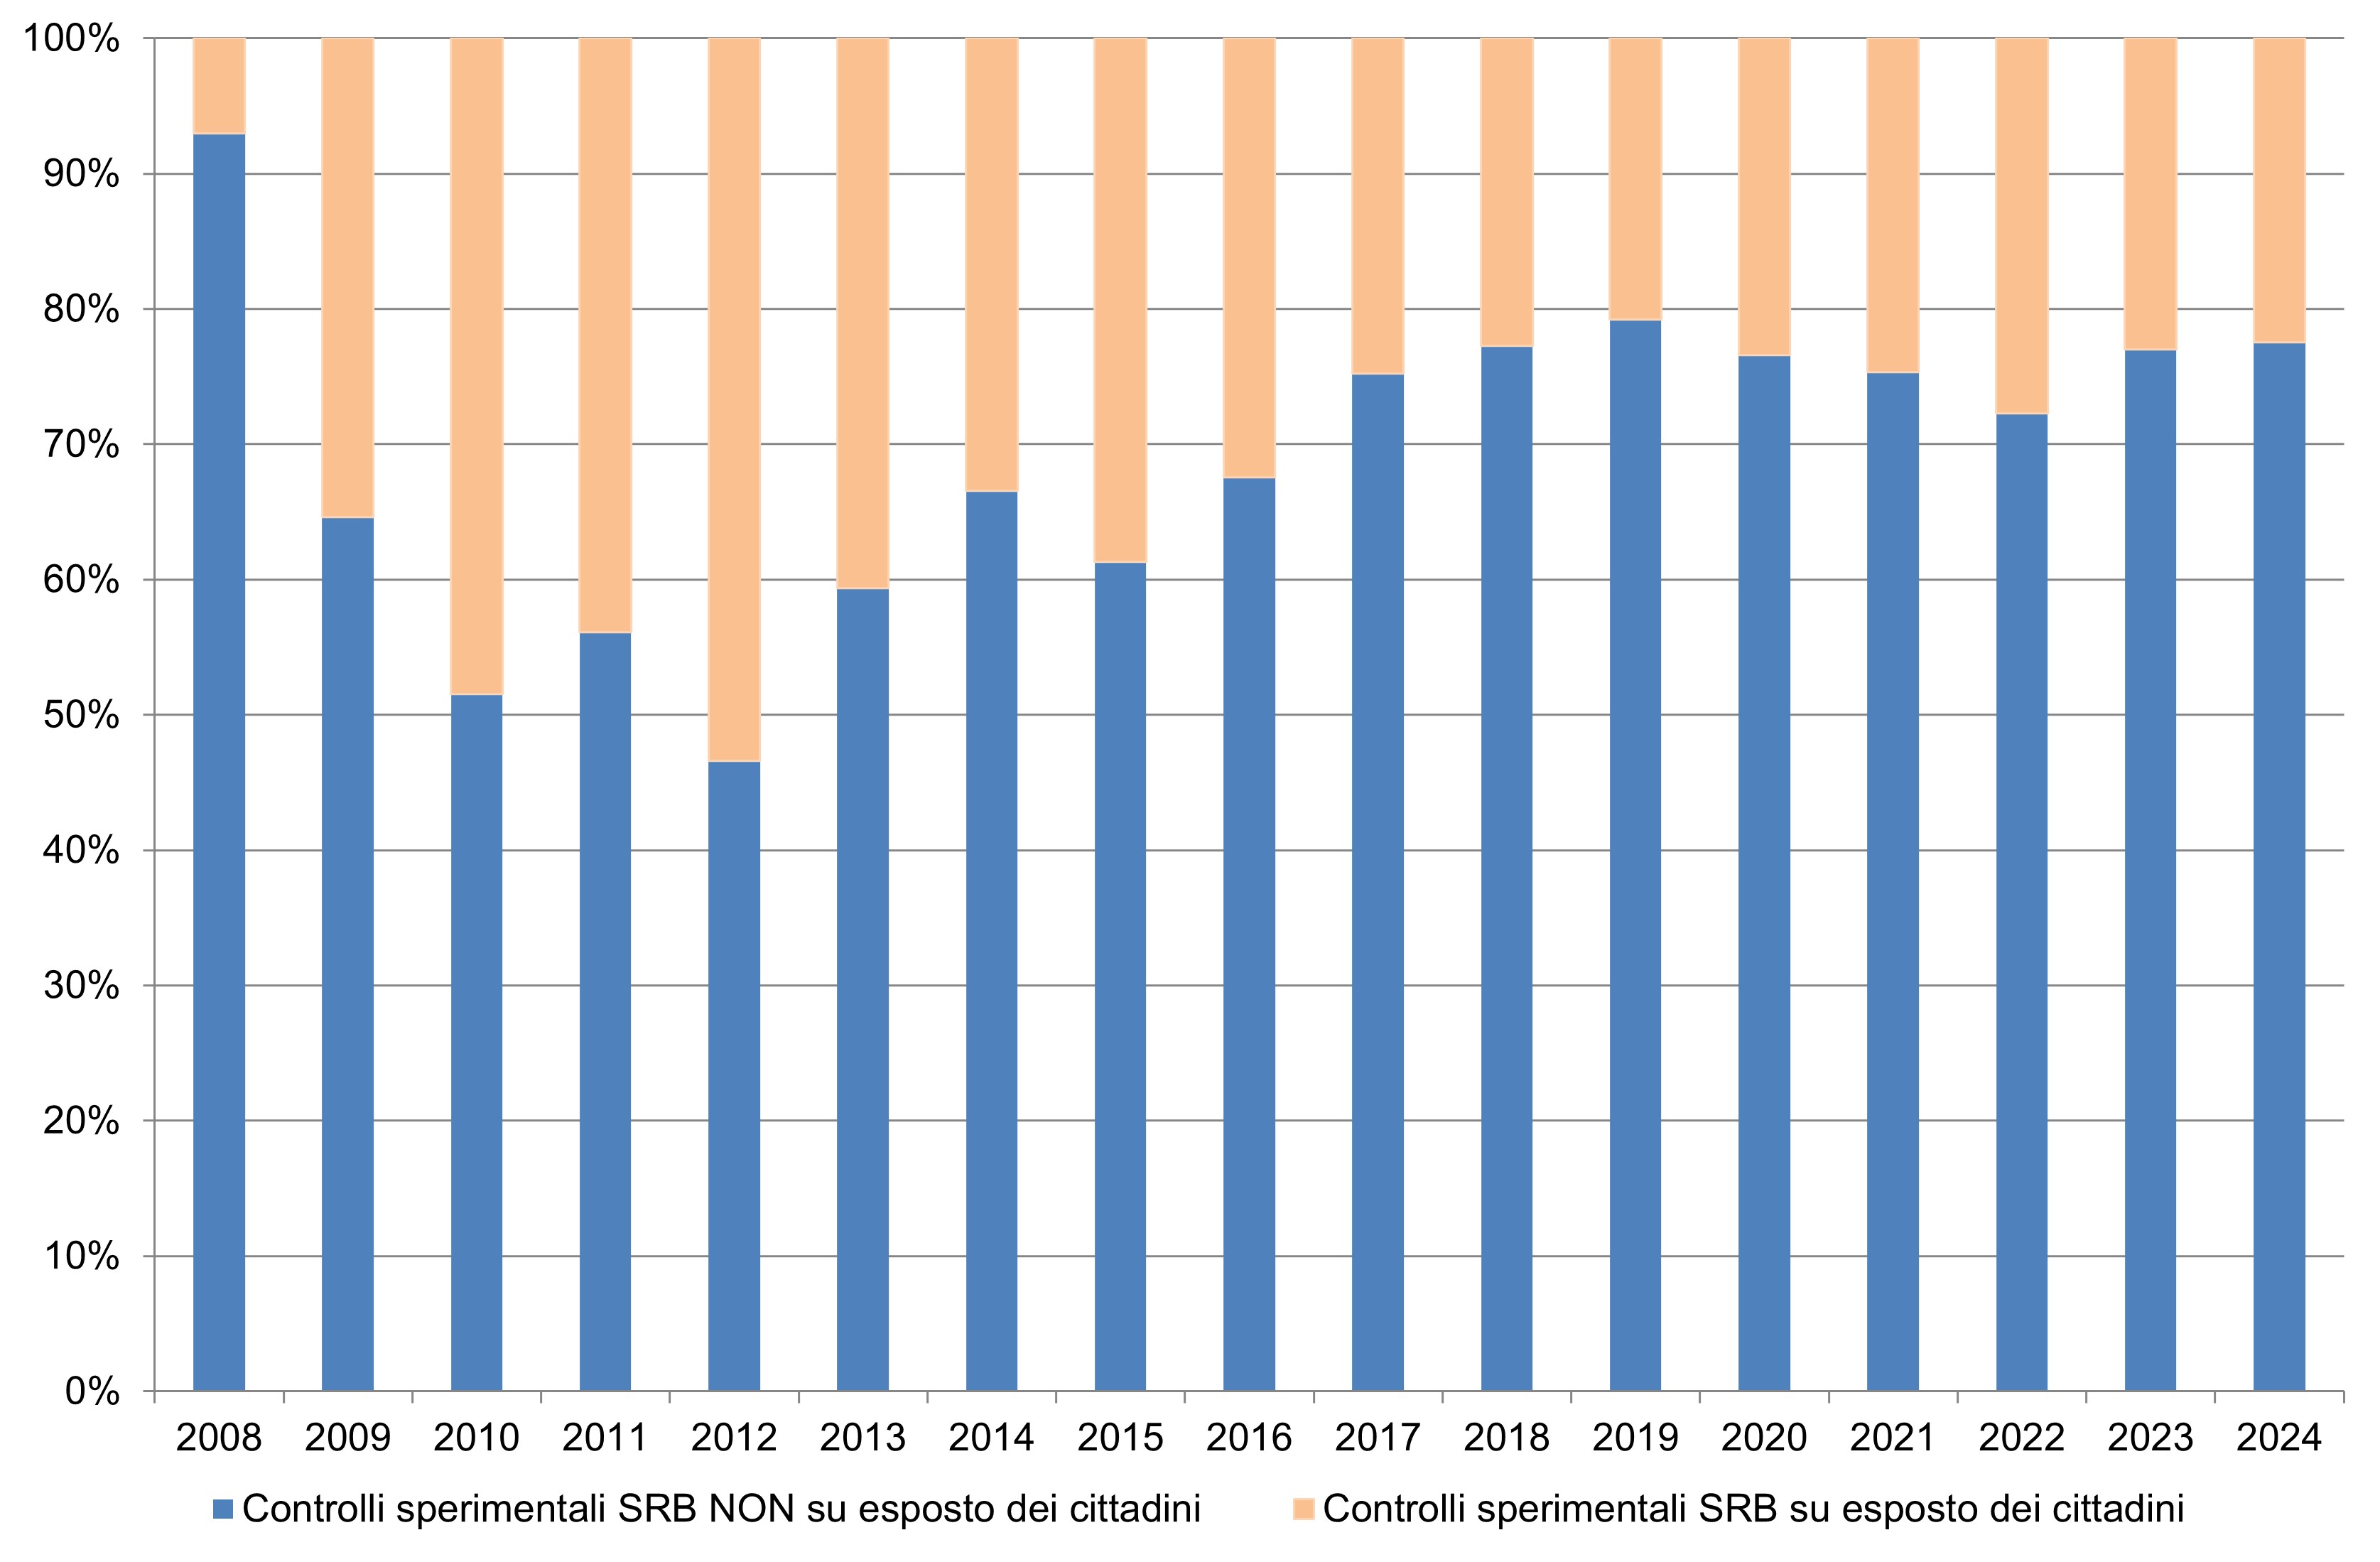
Regarding the percentage of checks carried out by ARPA/APPA on citizens' complaints compared to the total checks for RTVs, from 2008 to 2021 there is a generally decreasing trend from 53% to 7% while from 2021 this percentage rises to 22.8% in 2024 (Figure 3), while for RBWs this percentage increases significantly from 2008 to 2012, going from 7% to 53%, and then gradually decreases until 2024 reaching 22.5% (Figure 4).
| Data |
|---|
Headline
Table 1: Opinions and inspections for RTV installations in Italy (2024). Data source
ISPRA processing based on ARPA/APPA data (EMF Observatory). Data legend
a For experimental inspections, the values in parentheses indicate those carried out upon request, where such information is available;
|
Headline
Table 2: Number of broadband manual measurements and monitoring campaigns carried out in the presence of RTV installations in 2024. Data source
ISPRA processing based on ARPA/APPA data (EMF Observatory). Data legend
a The data were not updated by the regional contact point;
|
Headline
Table 3: Percentages of broadband manual measurements and monitoring campaigns carried out in the presence of RTV installations in 2024, with electric field strength values divided into the four intervals: 3 V/m, 3–6 V/m, 6–20 V/m, and ≥ 20 V/m. Data source
ISPRA processing based on ARPA/APPA data (EMF Observatory). Data legend
a The data were not updated by the regional contact point;
|
Headline
Table 4: Opinions and inspections for BTS installations in Italy (2024). Data source
ISPRA processing based on ARPA/APPA data (EMF Observatory). Data legend
a For experimental inspections, the values in parentheses indicate those carried out upon request, where such information is available; |
Headline
Table 5: Number of broadband manual measurements and monitoring campaigns carried out in the presence of BTS installations in 2024. Data source
ISPRA processing based on ARPA/APPA data (EMF Observatory). Data legend
a The data were not updated by the regional contact point;
|
Headline
Table 6: Percentages of broadband manual measurements and monitoring campaigns carried out in the presence of BTS installations in 2024, with electric field strength values divided into the four intervals: 3 V/m, 3–6 V/m, 6–20 V/m, and ≥ 20 V/m. Data source
ISPRA processing based on ARPA/APPA data (EMF Observatory). Data legend
a The data were not updated by the regional contact point; * The data do not cover the entire regional territory; |
Thumbnail
Headline
Figure 1: Number of preventive opinions and experimental inspections carried out on RTV installations. Data source
ISPRA processing based on ARPA/APPA data (EMF Observatory). Data legend
For the above-mentioned trend analysis, both the Regions/Autonomous Provinces that provided complete data for the entire 2008–2024 time period for both RTV and BTS source categories, and those for which it was possible to integrate missing information by using the relevant data from the previous year or, if unavailable, from the first subsequent year available, were considered. |
Thumbnail
Headline
Figure 2: Number of preventive opinions and experimental inspections carried out on BTS installations. Data source
ISPRA processing based on ARPA/APPA data (EMF Observatory).
Data legend
For the above-mentioned trend analysis, both the Regions/Autonomous Provinces that provided complete data for the entire 2008–2024 time period for both RTV and BTS source categories, and those for which it was possible to integrate missing information by using the relevant data from the previous year or, if unavailable, from the first subsequent year available, were considered. |
Thumbnail
Headline
Figure 3: Number of experimental inspections carried out following citizens’ complaints and not following citizens’ complaints on RTV installations. Data source
ISPRA processing based on ARPA/APPA data (EMF Observatory).
Data legend
For the above-mentioned trend analysis, both the Regions/Autonomous Provinces that provided complete data for the entire 2008–2024 time period for both RTV and BTS source categories, and those for which it was possible to integrate missing information by using the relevant data from the previous year or, if unavailable, from the first subsequent year available, were considered. |
Thumbnail
Headline
Figure 4: Number of experimental inspections carried out following citizens’ complaints and not following citizens’ complaints on BTS installations. Data source
ISPRA processing based on ARPA/APPA data (EMF Observatory).
Data legend
For the above-mentioned trend analysis, both the Regions/Autonomous Provinces that provided complete data for the entire 2008–2024 time period for both RTV and BTS source categories, and those for which it was possible to integrate missing information by using the relevant data from the previous year or, if unavailable, from the first subsequent year available, were considered. |
RBS sources are subject to greater control by ARPA/APPA than RTV systems also in relation to their operating characteristics such that they require widespread territorial diffusion, especially in urban areas. From what can be seen from the data (Tables 1, 2 and 3), the control activity, even in the face of a stagnation or slowdown in the growth of new installations in the area, is still carried out by the Agencies to monitor critical situations in the area and to respond to the control needs of these electromagnetic sources requested by citizens. In order to evaluate the electric field levels in the presence of RTV and RBS systems, the results of the measurements carried out during the control activity carried out in 2024 by the various ARPA/APPA were collected at a regional level. These results, reported in (Table 3 and 6), are expressed in terms of percentages of manual broadband measurements and monitoring campaigns carried out in 2024 with electric field values included in the four intervals < 3 V/m, 3-6 V/m, 6-20 V/m, ≥ 20 V/m. This information provides a further interesting comparison between the two different types of electromagnetic sources (RTV and RBS) in terms of electric field values released into the environment. By analyzing the levels of electromagnetic field emitted by these sources found by the measurement activity carried out by the ARPA/APPA, the RTV systems appear to have a greater impact in terms of non-compliance situations compared to the BTSs; it is clear that in the regions where a greater number of manual broadband measurements and monitoring campaigns have been carried out, the information relating to the electric field levels present in the environment is more representative of the territorial reality of reference. The social impact aspect linked to the population's perception of risk regarding the electromagnetic fields emitted by these two types of RTV and BTS sources is still relevant in both cases considering the percentages of checks carried out at the request of citizens compared to total checks (21.2% and 22.9% respectively); the intense control activity carried out by ARPA/APPA over the years has contributed to significantly stemming the phenomenon of social alarmism generated by the presence of such systems in the area and the fears linked to exposure to the electromagnetic fields generated by them.