Giovanni Finocchiaro, Andrea Gagna, Mariangela Soraci
The EPRTR (European Pollutant Release and Transfer Register) is the integrated register established by the EU through Regulation (EC) No 166/2006 to provide public access to information on the environmental impacts of industrial installations that exceed specific thresholds for pollutant emissions or transfers of pollutants and waste.
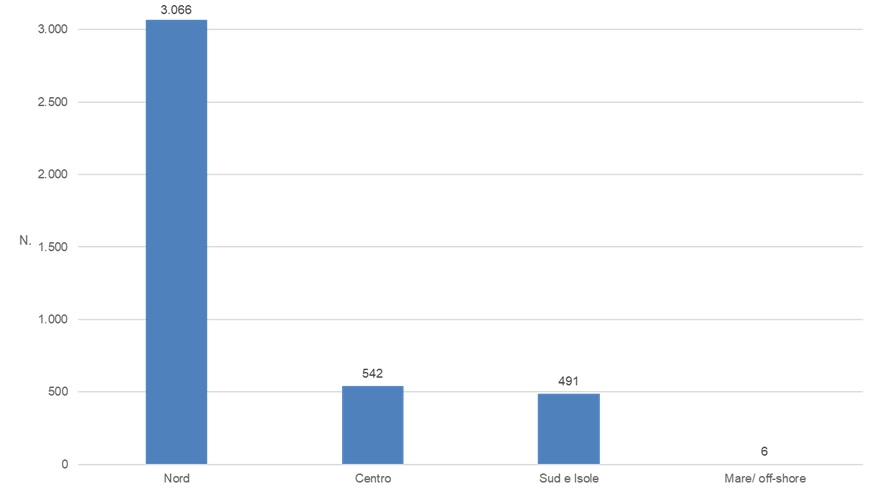
In 2023, the industrial sources most relevant for emissions to air, water, and soil numbered 4,105, of which 3,066 were located in Northern Italy, 542 in Central Italy, 491 in Southern Italy and the Islands, and 6 offshore.
The indicator represents the set of industrial sources responsible for the majority of emissions to air and water. The number and type of PRTR (Pollutant Release and Transfer Register) activities declared make it possible to identify the main industrial activities and processes that act as emission sources.
Most reporting installations fall within the activities listed in Annex VIII to Part Two of Legislative Decree No. 152/2006, as amended, and therefore the indicator is also representative of the contribution of installations subject to Integrated Environmental Authorisation (AIA) (formerly IPPC).
Information on the number of installations and PRTR activities is collected through PRTR declarations. Legislation requires PRTR installations whose emissions to air or water or discharges—also for a single pollutant—exceed the relevant threshold values, or which transfer waste above the relevant thresholds, to submit a declaration. The number of declarations received by ISPRA corresponds to the number of installations subject to mandatory reporting to the national PRTR register (Regulation (EC) No 166/2006; Presidential Decree No 157/2011; Article 30 of Legislative Decree No 46/2014).
In summary, the criteria are based on a system of thresholds referring to:
- a list of activities (thresholds associated with production or treatment capacity);
- a list of substances to be monitored for air and water (specific emission thresholds for each pollutant and environmental medium);
- waste transfers, both hazardous and non-hazardous (thresholds based on the quantity transferred).
To describe the territorial distribution of PRTR installations across Italy and to identify the most significant PRTR/IPPC activities as sources of pollutant emissions and waste transfers, which at national level contribute most to emissions and transfers generated by industrial processes.
- Regulation (EC) No 166/2006
- Presidential Decree No 157/2011
- Article 30 of Legislative Decree No 46/2014
Through PRTR declarations, the legislation provides for the annual electronic collection of information on:
- identification of reporting PRTR installations;
- identification of PRTR activities carried out;
- emissions to air, water, and soil;
- transfers of pollutants in wastewater;
- transfers of waste.
The national PRTR register is updated annually. Legislation also guarantees public access to the register and the transmission of information to the European Commission for the annual update of the European EPRTR.
The PRTR data collection system, based on self-reporting by installations and validation by competent authorities, leaves room for further improvements in data completeness. In-depth analyses of specific activities may lead to changes in the reporting base and related indicators. Ongoing data quality assessment by competent authorities may also result in an expansion of the reporting base for the PRTR register in the coming years.
ISPRA
Information on the number and type of PRTR installations in Italy and their impacts (emissions and transfers) is freely available on the European EPRTR website:
https://industry.eea.europa.eu/#/home
National Regional
2007-2023
Aggregations and disaggregations by geographical parameters and PRTR codes.
Comparing the latest available year with the previous one, the number of reporting installations decreased slightly from 4,111 in 2022 to 4,105 in 2023 (–0.15%). The level is therefore stable and overall good: all major industrial categories listed in Figure 3 are represented, with only a few absent activities (asbestos production, intensive aquaculture, smokeless solid fuels), either because they are not authorised, not present, or not subject to reporting obligations under the national PRTR register.
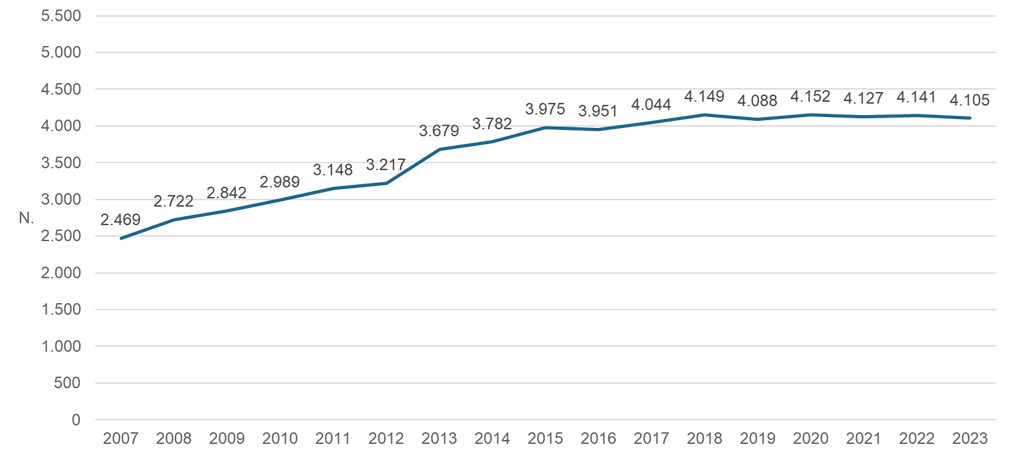
Analysis of the full 2007–2023 time series (Figure 1) shows a 66% increase—from 2,466 to 4,105 installations—with an average annual growth of 3.1% up to 2020, followed by stability in the 2021–2023 period. The long-term trend therefore remains positive, while recent dynamics indicate that a saturation threshold has been reached.
| Data |
|---|
Thumbnail
Headline
Figure 1: Trends in establishments declared to the national PRTR Data source
ISPRA, PRTR national register |
Thumbnail
Headline
Figure 2: Geographical distribution of PRTR factories by macro area (2023) Data source
ISPRA, PRTR national register |
Thumbnail
Headline
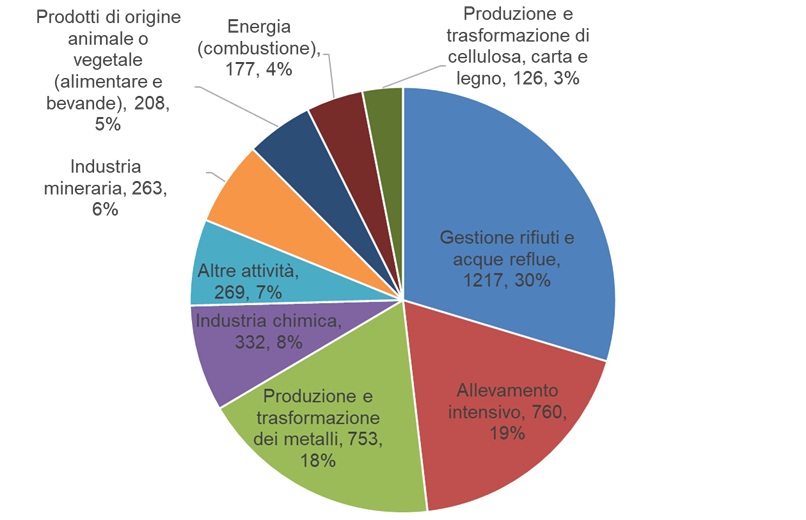
Figure 3: Percentage distribution by main activity (2023) Data source
ISPRA, PRTR national register |
Headline
Table 1: PRTR factories by geographical macro area (2023) Data source
ISPRA, PRTR national register |
As shown in Figure 1, between 2007 and 2020 the PRTR register grew from 2,466 to 4,127 installations; over the last three years the curve has stabilised, with the slight decline observed between 2022 and 2023 noted in the status assessment.
The territorial distribution remains strongly skewed towards Northern Italy, which hosts 75% of installations (Figure 2). Three sectors—waste and wastewater management, intensive livestock farming, and metallurgy—account for nearly two thirds of all declarations (Figure 3), confirming the close link between the register and industrial sectors with the highest emission potential.