Antonio Caputo, Riccardo De Lauretis, Francesca Palomba
The indicator concerns atmospheric emissions of sulfur dioxide (SO₂), a primary precursor of acidification processes. Sulfur dioxide emissions originate predominantly from energy-related activities. In 2023, such activities accounted for 92.1% of total SO₂ emissions. These emissions primarily result from the combustion of fossil fuels (including power generation plants, residential heating systems, and transport). Mitigation of SO₂ emissions can be achieved through improvements in fuel quality and/or via flue gas treatment technologies. The reduction in SO₂ emissions from energy-related processes (−96.1% in 2023 compared to 1990 and −98.1% compared to 1980), attributable to the use of low-sulfur fuels and the deployment of emission abatement systems, has thus far ensured compliance with international protocols addressing acidification. Overall SO₂ emissions in 2023 were 82.5% lower than those recorded in 2005.
The indicator refers to atmospheric emissions of sulphur dioxide (SO₂), which are a primary cause of acidification processes. Sulphur dioxide emissions originate essentially from the use of fossil fuels (power generation plants, residential heating, and transport); they can be reduced by improving fuel quality and/or through the treatment of process gas effluents.
To assess the role of energy processes in relation to sulphur dioxide emissions, with the aim of reducing the contribution of energy use to air pollution.
Directive 2001/81/EC, transposed into Italian law by Legislative Decree No. 171 of 2004, set the national SO₂ emission ceiling to be achieved by 2010 and maintained in subsequent years at 475 kt. The Directive represents the EU transposition of the 1999 Gothenburg Protocol aimed at combating acidification, eutrophication, and ground-level ozone.
Directive 2001/81/EC was repealed by Directive (EU) 2016/2284, transposed in Italy through Legislative Decree No. 81 of 2018, which established new national SO₂ emission reduction commitments. Unlike the previous legislation, the target is no longer expressed in absolute value, but as a percentage reduction: a 35% reduction from 2005 levels for any year from 2020 to 2029, and a 71% reduction from 2005 levels starting in 2030.
ISPRA, Quality Assurance/Quality Control Plan for the Italian Emission Inventory, Several years, https://emissioni.sina.isprambiente.it/inventario-nazionale/
ISPRA, Informative Inventory Report, Several years, https://emissioni.sina.isprambiente.it/inventario-nazionale/
The relevance of the indicator decreases when moving from the national to the local level, due to the uneven distribution of energy production and consumption across the national territory.
ISPRA
ISPRA, Atmospheric Emissions Inventory, https://emissioni.sina.isprambiente.it/inventario-nazionale/
National
1980-2023
Estimate carried out within the framework of the preparation of the national emissions inventory. To calculate data at regional and provincial levels, certain information must be estimated in the absence of specific statistical surveys.
The NEC Directive (2016/2284) established national sulfur dioxide (SO₂) emission reduction targets for each year from 2020 to 2029, as well as for any year from 2030 onwards. Specifically, for Italy, the 2023 target was set at 267.16 kilotonnes (kt) of national SO₂ emissions, corresponding to a 35% reduction compared to 2005 levels. The 2030 target is set at 119.20 kt of national SO₂ emissions, equivalent to a 71% reduction compared to 2005, and has already been achieved.
In 2023, the energy sector was responsible for emitting 66.1 kt of SO₂ into the atmosphere, accounting for 92.1% of the national total (Table 1). This represents a reduction of 83.3% compared to 2005 levels, thereby playing a key role in achieving the prescribed emission reduction target.
The reduction in sulfur dioxide (SO₂) emissions from energy-related processes (−96.1% in 2023 compared to 1990 and −98.1% compared to 1980), driven by the use of cleaner fuels and energy carriers, has so far ensured compliance with international protocols on acidification.
| Data |
|---|
Headline
Table 1: Total sulfur dioxide emissions and emissions from energy-related processes (a) Data source
ISPRA Data legend
(a) Excluding emissions from natural sources (e.g., volcanoes) |
Thumbnail
Headline
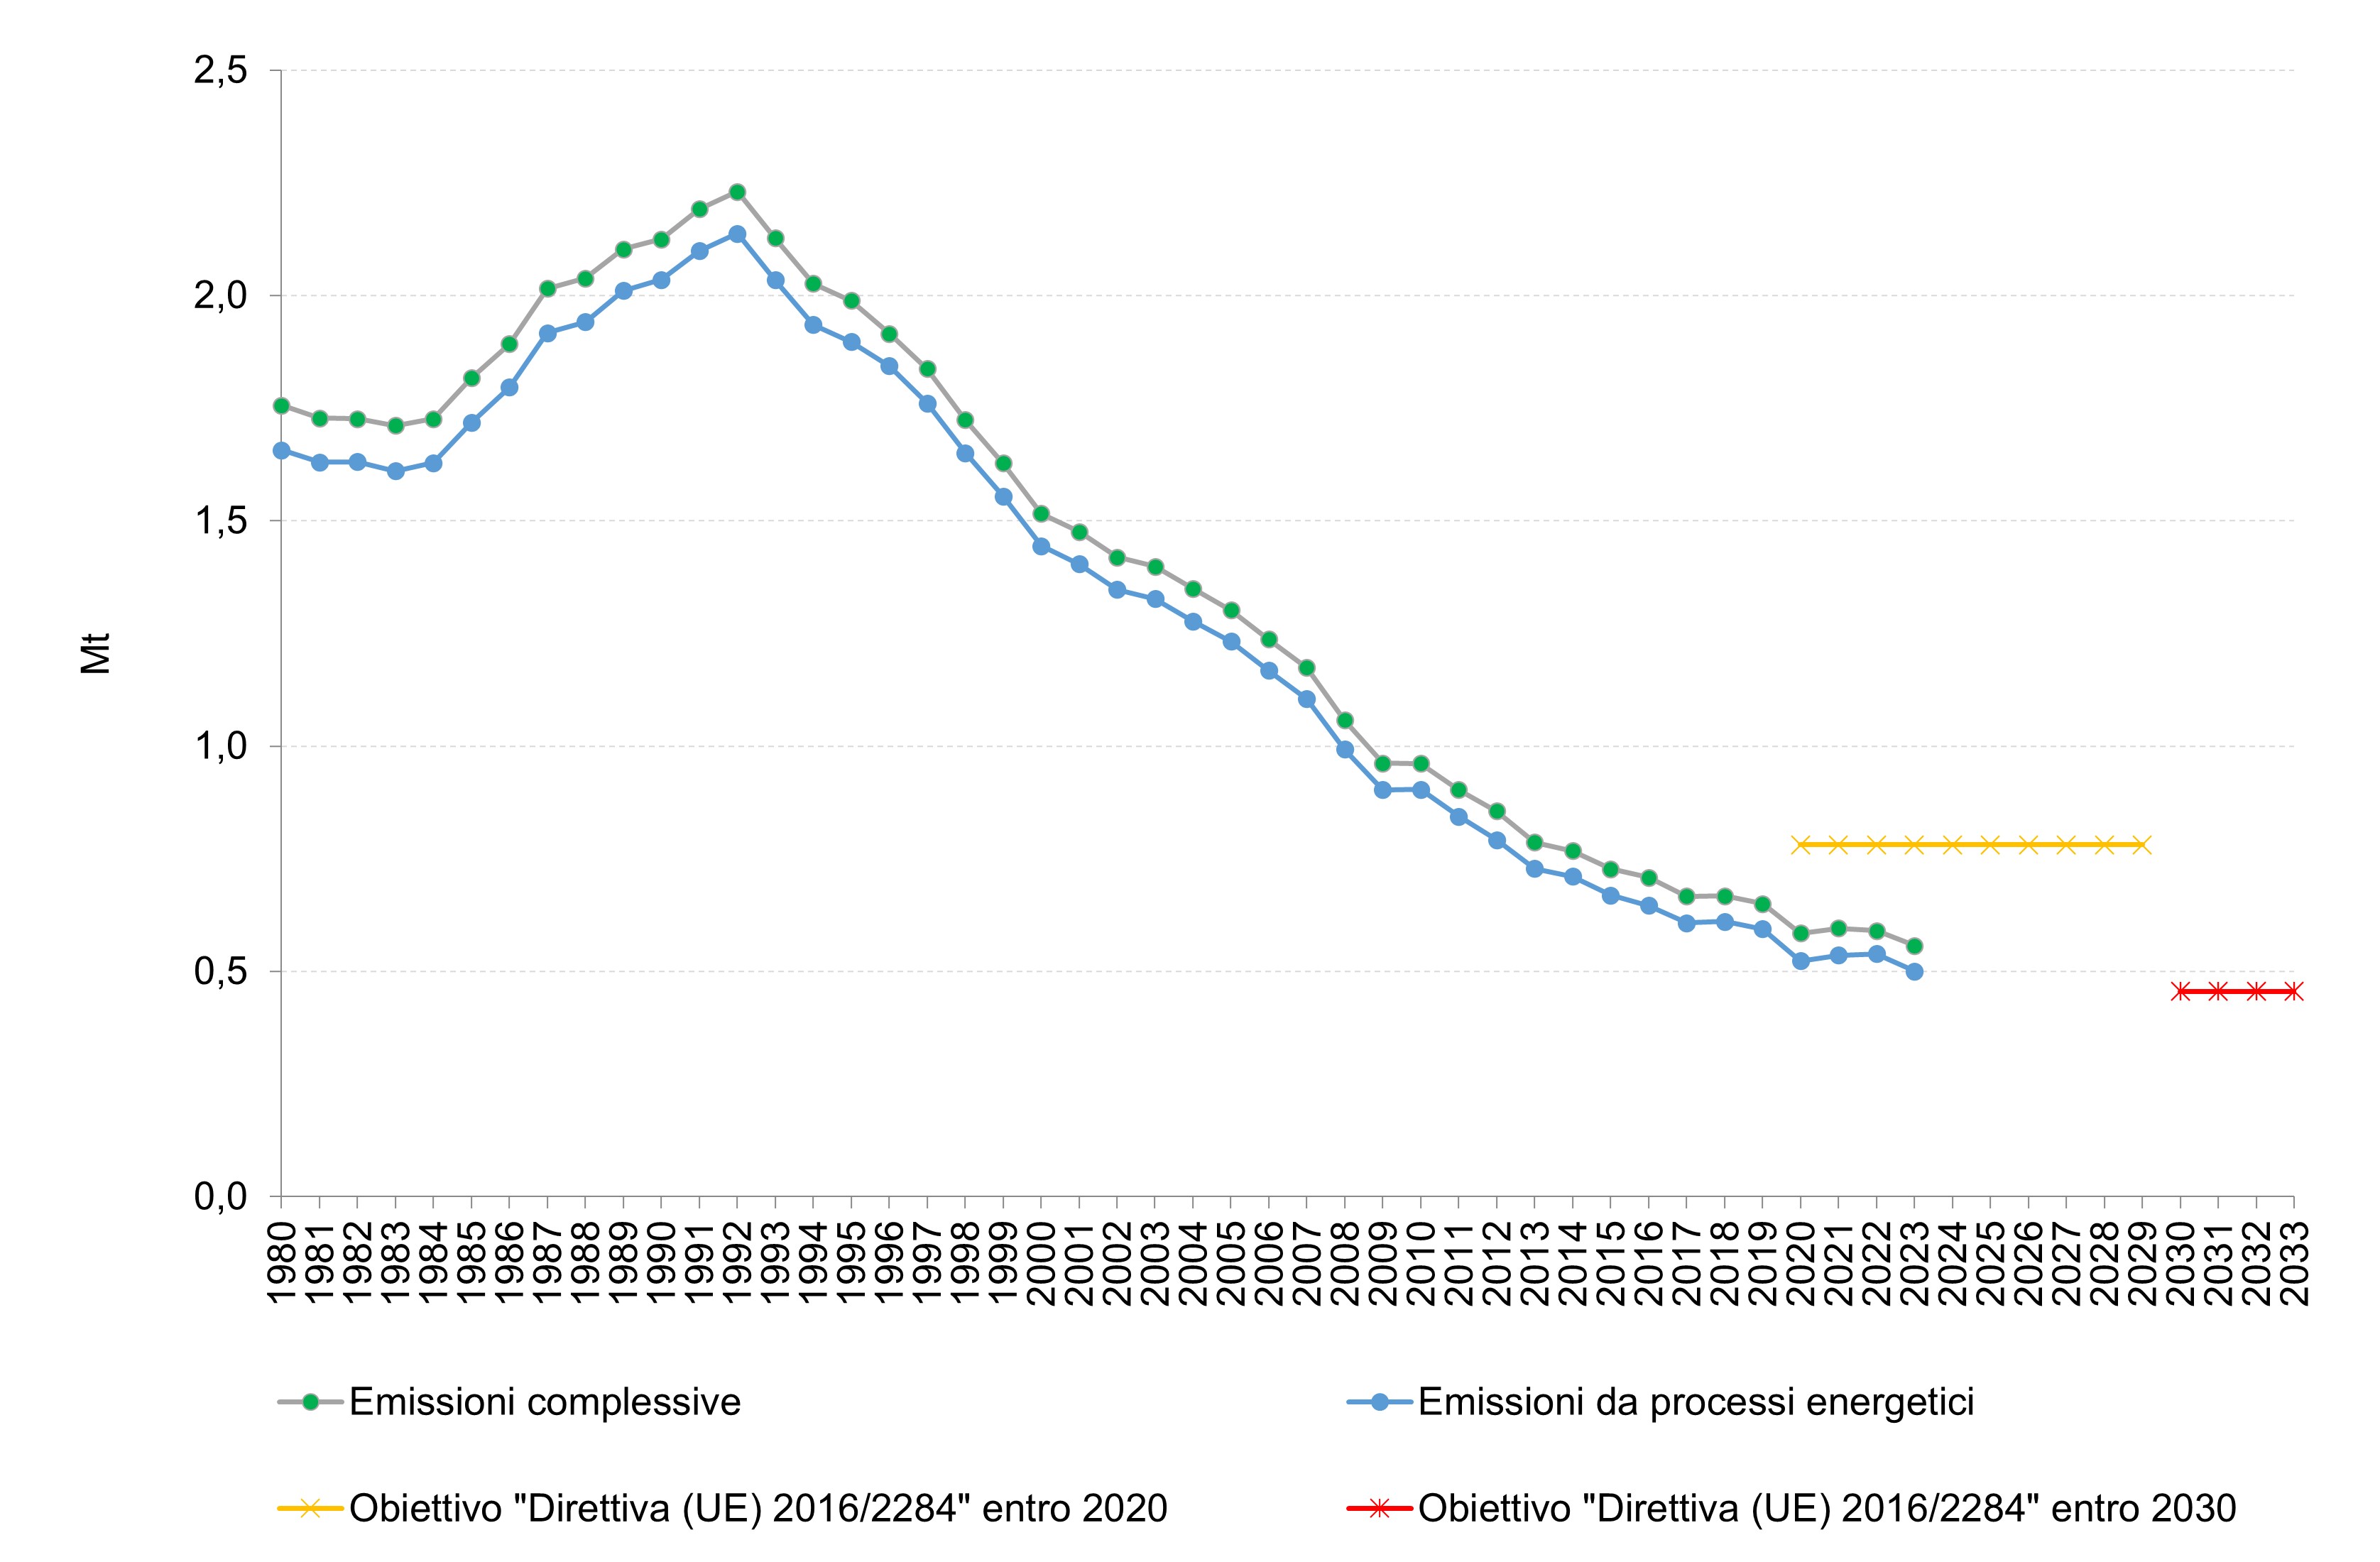
Figure 1: Total sulfur dioxide emissions and emissions from energy-related processes (a) Data source
ISPRA Data legend
(a) Excluding emissions from natural sources (e.g., volcanoes) |
Sulfur dioxide (SO₂) emissions originate predominantly from energy-related processes. In 2023, these processes accounted for 92.1% of total national SO₂ emissions. The decrease in the sulfur content of fuels used in energy production, along with the implementation of more effective emission abatement systems, is reflected in the declining relative contribution of energy-related processes to total SO₂ emissions—from 98.6% in 1997 to 92.1% in 2023 (Table 1 and Figure 1).
It should be noted that, in order to ensure consistency and comparability of the inventory, the annual update of emissions entails a revision of the entire historical time series based on the most up-to-date information and methodological developments.