Antonio Caputo
The indicator measures how many MJ of fossil fuel are needed to produce one kWh of electricity, thus monitoring the efficiency of our energy system. From 1996 to 2024, specific consumption decreased by 21.6% (gross production) and 23.3% (net production). This is a clearly positive trend, which certifies how thermoelectric power plants have over time become capable of producing more energy while wasting fewer resources with a consequent increase in the efficiency of the electricity production of the thermoelectric park.
The indicator measures the primary energy, in MJ, needed to produce one kWh of electricity.
Evaluate the efficiency of converting primary energy from fossil fuels into electricity for final consumption.
Not applicable
TERNA S. p. A, Statistical data on electricity in Italy, various years
The average data are significant only at a national level due to the lack of homogeneity of the types of systems and fuels used.
Terna - Rete Elettrica Nazionale S. p. A.
Terna, "Statistical data on electricity in Italy, various years" https://www. terna. it/it/sistema-elettrico/statistiche/pubblicazioni-statistiche
National
1996-2024
The data is collected and processed directly by TERNA. The value indicated as TOTAL in this table represents the weighted average specific consumption of primary energy (expressed in megajoules, MJ) necessary to produce one kilowatt hour (kWh) of electricity.
It is not obtained by doing a simple sum or an arithmetic average of the column values, because each fuel contributes to a different extent to the total production of electricity.
Instead, it is calculated through a weighted average, using the following formula:
Total= (Summation (Specific consumption the for Energy produced the ))/Total energy produced
How the calculation works:
-
Specific consumption the for Energy produced the (Primary Energy Consumed): For each category of fuel, its specific consumption (the value in the table, e. g. 9.19 for solids in 1996) is multiplied by the total quantity of electrical energy (in kWh) actually produced by that fuel in that specific year. This calculation gives us the total megajoules of thermal energy consumed by that specific source.
-
Sum of total consumption: All megajoules of primary energy consumed by all sources in the reference year are added to obtain the overall national primary energy consumption.
-
Final division: This overall thermal consumption (MJ) is divided by the total national electrical production (the sum of all kWh produced by all thermoelectric sources in that year).
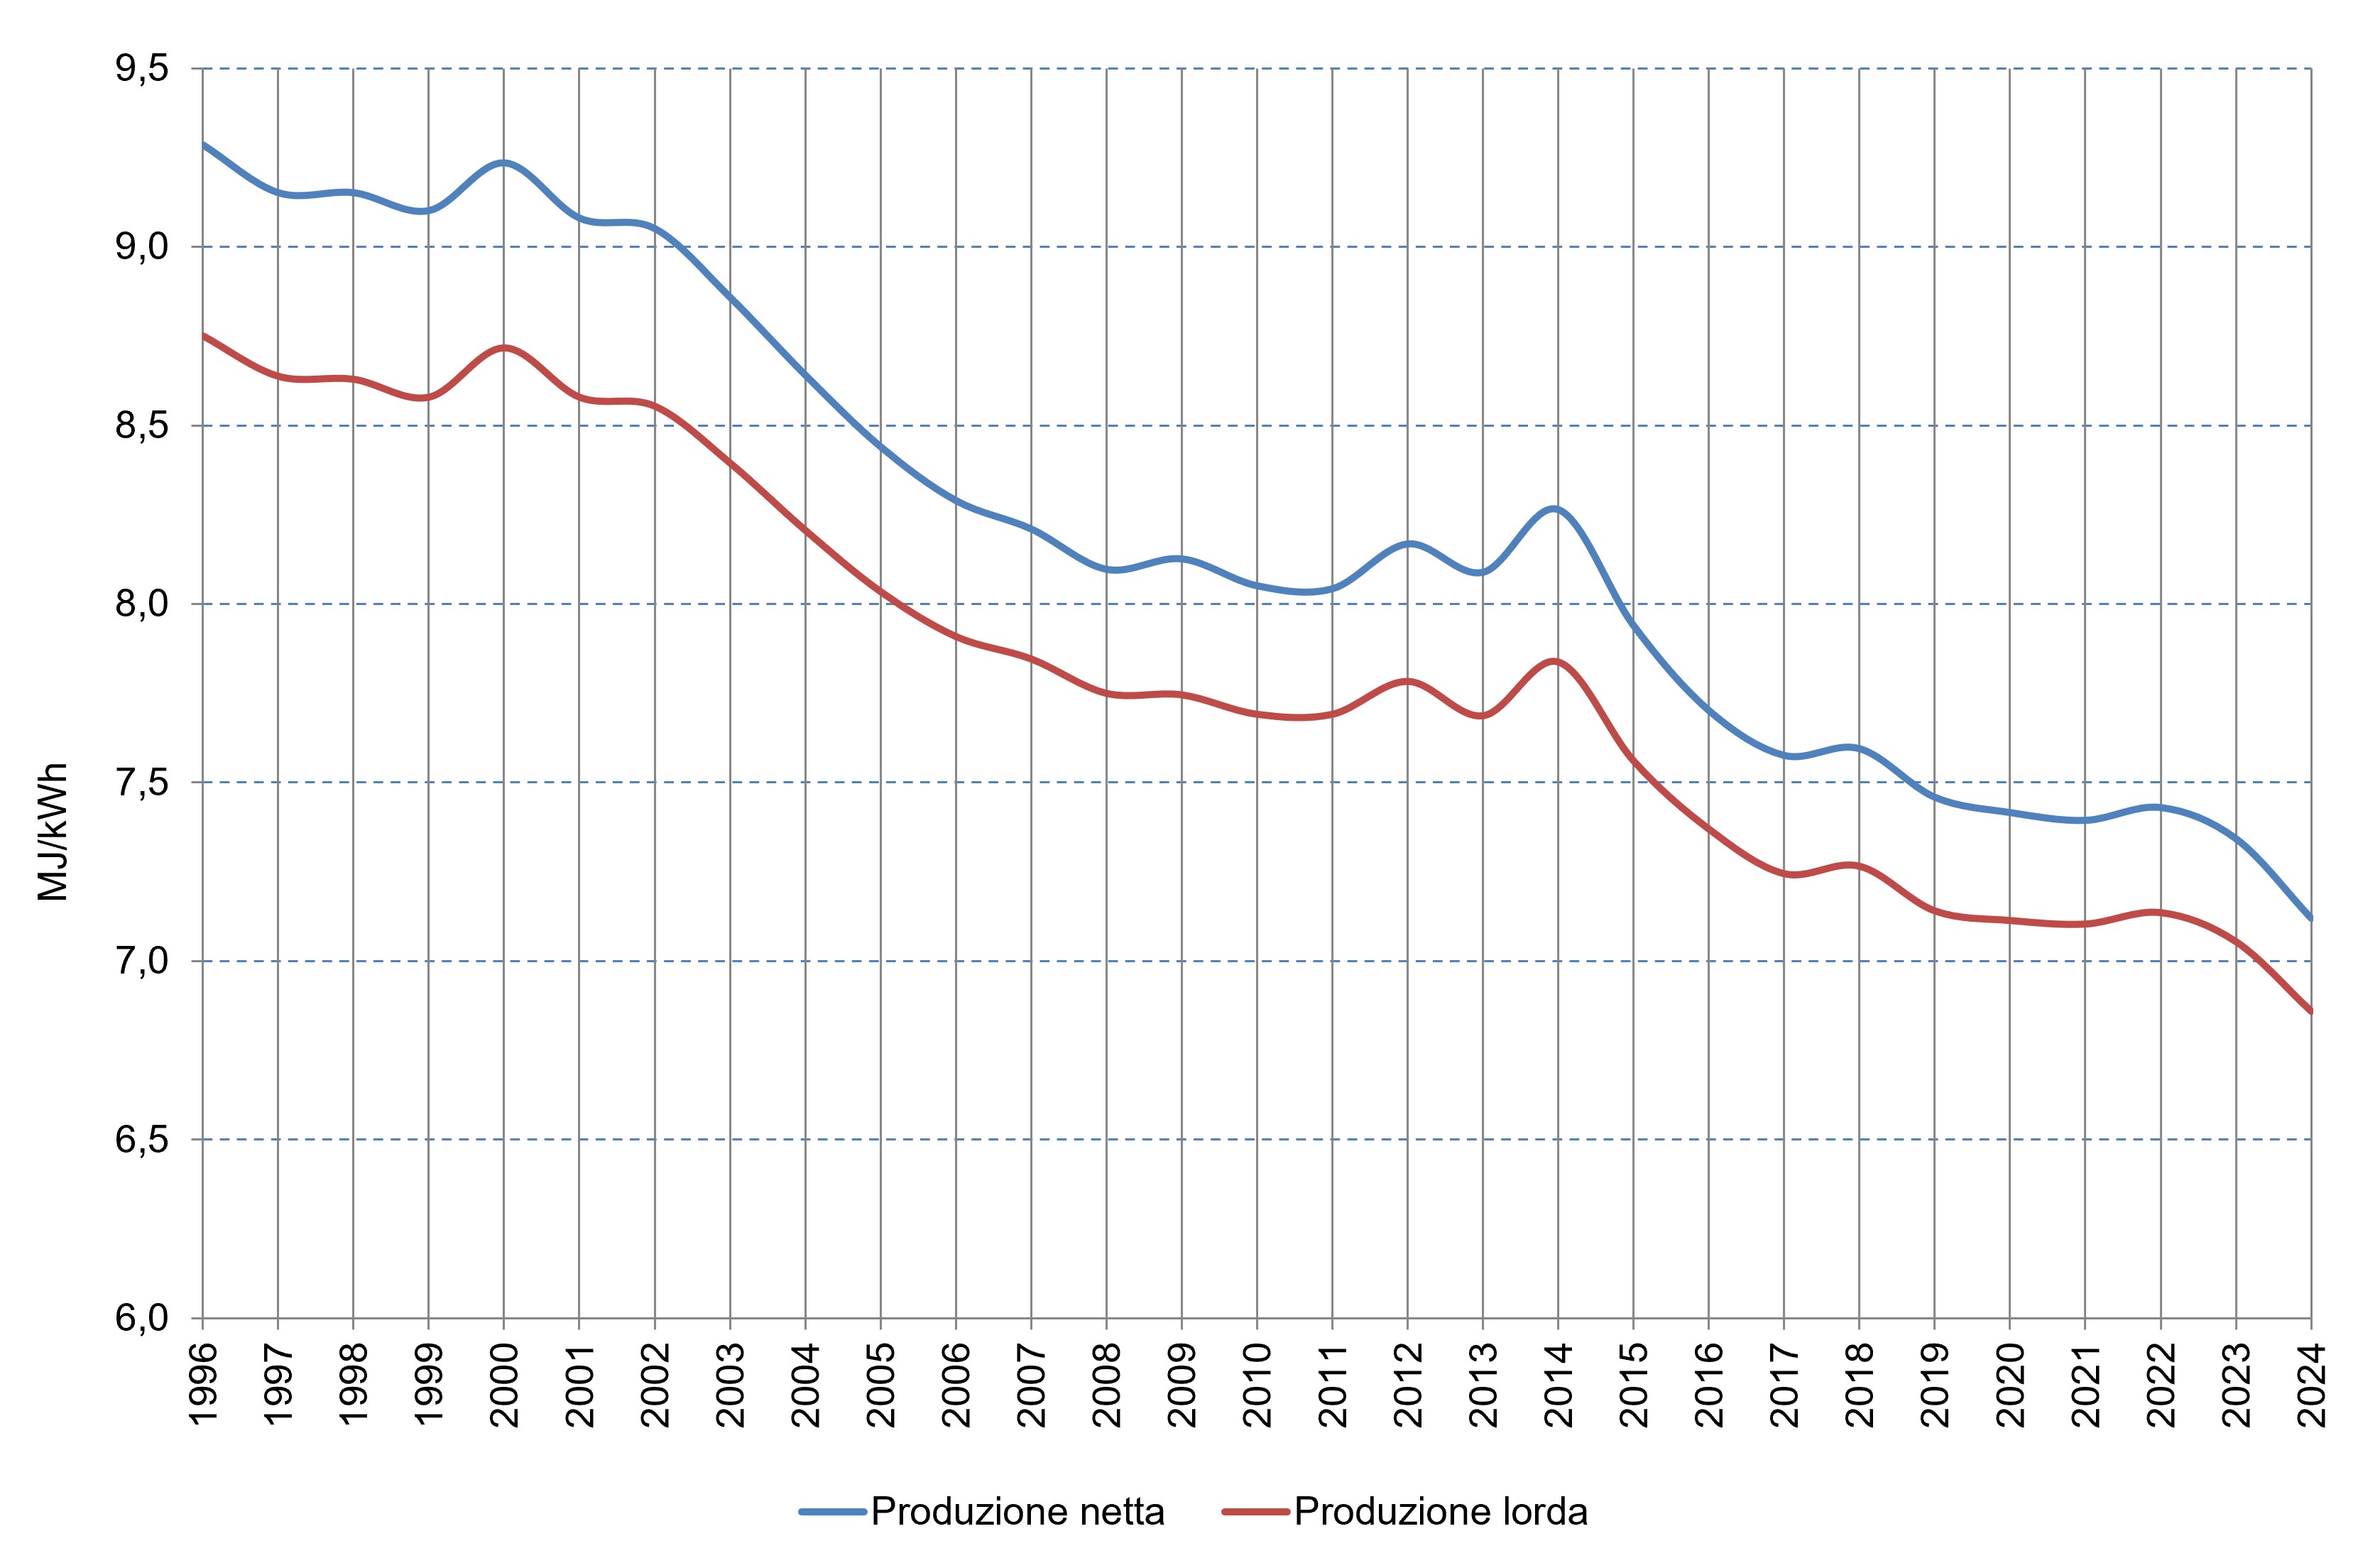
The specific consumption of fuels for gross electricity production in 2024 was 6.86 MJ/kWh, while for net production it was 7.12 MJ/kWh. Compared to the previous year, specific consumption in 2024 shows a decrease of 2.8% for gross production and 3% for net production (Tables 1 and 2). Natural gas records the lowest specific consumption ever: 6.43MJ/kWh for net production and 6.27MJ/kWh for gross. Solid fuels (coal/lignite) and derived gases show the highest specific consumption (10.81MJ/kWh and 9.37MJ/kWh net respectively), translating into lower yields. Comparing the gross data with the net ones, we observe that the most marked gap is present in coal (solids) with 1.39MJ/kWh while the smallest is in natural gas (0.16MJ/kWh), demonstrating that solids plants require much more internal energy to operate and reduce pollutants.
Between 1996 and 2024, the primary energy needed to produce a single kilowatt hour fell by 21.6% for gross production and by 23.3% for net production, going from 9.29 to just 7.12 MJ/kWh (Figure 1). The long-term trend of the indicator shows a constant increase in the electricity production efficiency of the thermoelectric park until 2008 which subsequently seems to stabilize. After a surge in average specific consumption in 2014, a significant decrease has been observed in recent years, reaching a value of 7.10 MJ/kWh in 2021 followed by a slight increase in 2022 and a new decrease in 2023. The main responsible for this trend was natural gas which reduced its specific consumption from 8.73 to 6.43 MJ/kWh (-26%) managing to offset the increase of the specific consumption of coal: which rose from 9.94 MJ/kWh in 1996 to a peak of 11.42 in 2020, and then settled at 10.81 in 2024. Petroleum products have had a parabolic trend: after a period of increase in specific consumption until 2009 with over 10 MJ/kWh, in recent years there has been a decrease in consumption, reaching historical minimum of 7.67 MJ/kWh in 2024. The specific consumption of solid fuel in gross electricity production shows growth from 1999 to 2008, followed by a constant decrease until 2012 and a subsequent fluctuating trend which becomes increasing from 2017 until reaching the highest value of the series in 2021 (Table 1). In 2024 the specific consumption of solid fuel for the gross production of electricity has approximately the same value as in 2001 while natural gas shows a decrease of 21%. In the same period, other solid fuels other than coal show an increase in specific consumption of 24%. Particularly significant appears to be the constant decrease in the specific consumption of other gaseous fuels with a decrease of 20%.
| Allegati |
|---|
Headline
Tabella 1: Consumi specifici di combustibili - produzione netta Data source
Terna, Eurostat |
Headline
Tabella 2: Consumi specifici combustibili - produzione lorda Data source
Terna, Eurostat |
Thumbnail
Headline
Figura 1: Consumi specifici medi di combustione nella produzione di energia elettrica Data source
Terna, Eurostat |
The reason for the decreasing trend in specific consumption relating to the production of electricity is to be found in the progressive entry into operation of combined cycle plants - with higher efficiency than that of traditional plants - powered by natural gas or derivative gases. Furthermore, new generation combined cycles have greater efficiency than those previously put into operation. The drastic reduction in specific (and total) natural gas consumption between 2000 and 2015 is due to the technological renewal of the Italian power plant fleet. In this period, the old traditional steam thermal power plants were decommissioned and Combined Gas Cycles (gas turbine + steam turbine) were massively installed. CCGTs have projected electrical efficiencies from 38-40% to over 55-60%, drastically lowering the MJ needed per single kWh.
The worsening of the net efficiency of solid fuels is explained by the introduction of stringent European regulations on emissions (IED Directives and subsequent BREFs). To remain active, coal plants have had to install desulfurization (FGD), nitrogen oxide reduction (SCR) and dust capture systems. These systems capture enormous portions of the electricity produced by the power plant itself to operate (increase in self-consumption), causing specific consumption to soar net for the same amount of fuel burned.
Petroleum products have been progressively confined to a marginal role. The collapse in specific consumption in recent years (especially post-2020) indicates that only very few highly efficient plants or high-efficiency industrial cogeneration plants remain active, while the old fuel oil plants have been definitively decommissioned.
In recent years (2018-2024), the stabilization of trends indicates that the gas thermoelectric park has reached technological maturity and is mainly used as a flexible "back-up" to compensate for the intermittency of renewable sources (solar and wind).