Stefania Ercole
The wildfire phenomenon, analyzed on the basis of data collected from 1970 to 2024 by CUFA of the Carabinieri Corps (formerly the State Forestry Corps), shows a fluctuating trend, with peak years (1993, 2007, 2017, 2021) alternating with periods of decline (2013, 2014, 2018, 2024).
Wildfires occurring within Protected Areas (recorded since 2003), although showing annual fluctuations, remain at high levels, with an average of 11,000 hectares burned over the last three years.
The incidence of deliberately caused fires is very high, representing about half of all recorded events and exceeding 60% in some years.
Impact indicator showing, from 1970 onwards, the annual values of the number of fires and the total national area affected by fire (forested, non-forested, total, and average).
It also presents the percentage distribution of fires by cause (available from 1998) and the burned areas within Protected Areas in regions with ordinary administrative status (from 2003 onward).
To represent the complex phenomenon of wildfires in Italy, highlighting their extent, temporal trends, and main causes.
This indicator can serve, together with others, as a tool for evaluating the effectiveness of prevention and suppression policies on wildfires, as well as assessing the impacts of climate change.
Law 21 November 2000, n. 353 (Framework law on forest fires).
RaF Italy, 2017-2018. Report on the state of forests and the forestry sector in Italy. Produced by the National Rural Network (RRN 2014-2020); Forestry Company (AR).
SNPA, 2021. Report on climate change impact indicators – 2021 Edition. SNPA Report n. 21/2021. ISBN: 978-88-448-1058-0
Data on burned area and number of events alone are not sufficient to assess the magnitude of ecosystem damage, as different forest formations exhibit highly variable resistance and resilience.
-
Data available upon formal request to the CUFA of the Carabinieri Corps – Forest Protection Command, Wildfire Information Unit.
National
1970-2024
The indicator is based on wildfire data as defined by Article 2 of Law No. 353/2000, collected by CUFA Station Commands through the compilation of Wildfire Event Files (FEI), and subsequently cross-checked with regional AIB (Wildfire Prevention and Suppression) authorities.
For regions and provinces with special status, data are drawn from statistics provided by the respective Regional and Provincial Forestry Corps.
The status is classified as medium because the data show that wildfires continue to affect extensive areas of national territory, including important sectors within Protected Areas.
Although 2024 recorded a reduction in the total national area burned (32,519 ha in total) (Figure 1a, Table 1), the impact within Protected Areas remained high, with 11,578 hectares affected (Figure 1b, Table 2).
The proportion of deliberately caused fires remains worrying, amounting to 53.9% in 2024 (Figure 3b).
The trend cannot be clearly defined, as overall data reveal an oscillating pattern with alternating peaks and declines (Table 1, Figures 1a and 2).
A markedly critical period occurred in the 1980s and 1990s, during which fire incidence remained consistently high.
From the 2000s onward, there has been a general decrease, interrupted by high-impact years such as 2007, 2012, and 2017.
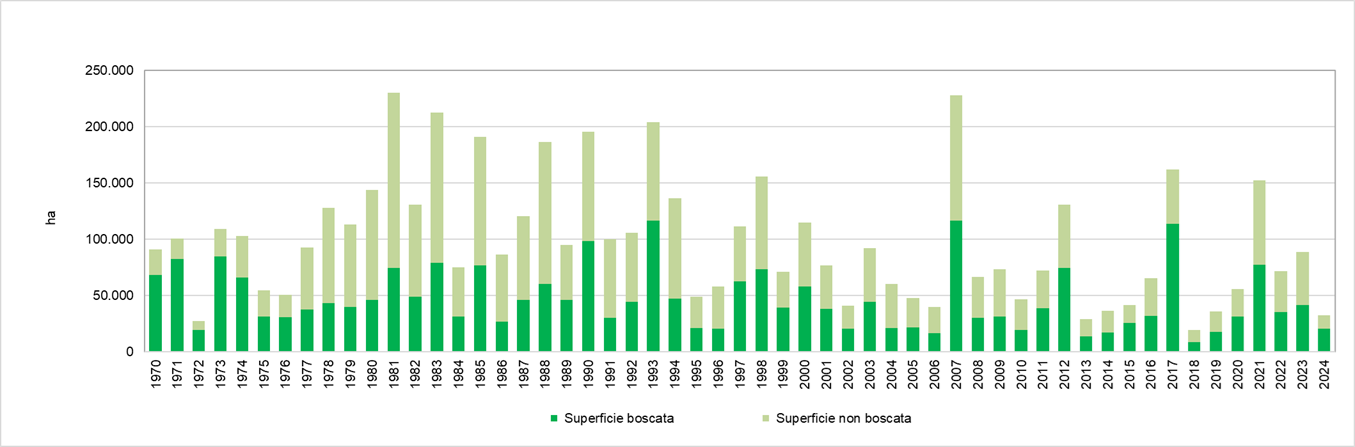
After a reduction in 2018, the phenomenon began to intensify again from 2019 to 2021 (Figure 1a), reaching a peak in 2021 with 151,964 hectares burned nationwide.
In 2024, the overall phenomenon decreased (Figure 1a), though fires within Protected Areas did not show the same reduction (Figure 1b).
| Allegati |
|---|
Titolo
Table 1: Area affected by fire and number of fires Fonte
CFS - State Forestry Corps; CUFA - Environmental and Agri-Food Forestry Unit Command of the Carabinieri |
Titolo
Table 2: Area affected by fire and number of fires in Protected Areas Fonte
CFS - State Forestry Corps; CUFA - Environmental and Agri-Food Forestry Unit Command of the Carabinieri Legenda
ND=data not available or not received Note
Data referring only to ordinary statute regions |
Thumbnail
Titolo
Figure 1a: Forested and non-forested areas affected by fire Fonte
CFS - State Forestry Corps; CUFA - Environmental and Agri-Food Forestry Unit Command of the Carabinieri |
Thumbnail

Titolo
Figure 1b: Forested and non-forested areas affected by fire in Protected Areas Fonte
CFS - State Forestry Corps; CUFA - Environmental and Agri-Food Forestry Unit Command of the Carabinieri |
Thumbnail
Titolo
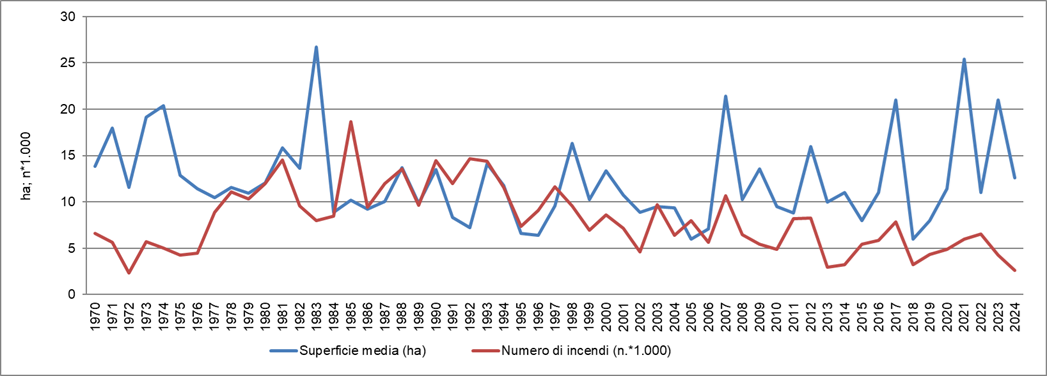
Figure 2: Average area affected by fire and number of fires Fonte
CFS - State Forestry Corps; CUFA - Environmental and Agri-Food Forestry Unit Command of the Carabinieri |
Thumbnail

Titolo
Figure 3a: Percentage distribution of the number of fires by cause (1998-2011) Fonte
CFS - State Forestry Corps; CUFA - Environmental and Agri-Food Forestry Unit Command of the Carabinieri Legenda
Data refer only to ordinary statute regions. Starting in 2012, a new harmonized European classification for causes was adopted, which is why there are two figures (3a and 3b). |
Thumbnail

Titolo
Figure 3b: Percentage distribution of the number of fires by cause (2012-2024) Fonte
CFS - State Forestry Corps; CUFA - Environmental and Agri-Food Forestry Unit Command of the Carabinieri Note
Data refer only to ordinary statute regions. Starting in 2012, a new harmonized European classification for causes was adopted, which is why there are two figures (3a and 3b). |
Analysis of the 50-year dataset (1970–2024) shows the dynamics of wildfires, particularly fluctuations in the annual number of events (Figure 2), the extent of national burned surfaces (forested and non-forested) (Figure 1a), and areas within Protected Zones (Figure 1b, data from 2003–2024 for regions with ordinary status).
Significant oscillations are evident, with peaks in certain years followed by improvements.
These improvements can be attributed to multiple factors, including enhanced prevention measures, better territorial monitoring, and faster emergency response operations.
In the 2000s, when wildfire impacts appeared somewhat mitigated, 2017 stood out as the most critical year, with 7,855 events and 161,987 hectares burned—31,899 of which were within Protected Areas (Figures 1a, 1b, 2, Table 1).
Subsequent years showed alternating improvements and declines.
In 2024, 2,588 events were recorded, burning a total of 32,519 hectares, of which 11,578 were within protected territories (36%) (Table 2).
Data on causes (available since 1998 and referring to regions with ordinary status) confirm that the majority of fires are deliberately set (Figures 3a and 3b).
Intentional fires represent more than half of all recorded events, exceeding 60% in some years (2012, 2014, 2015, 2016, 2020) (Figure 3b).
In 2024, 53.9% of fires were intentionally caused.
These figures highlight the need for increasingly strict enforcement measures, to be combined with preventive actions.